
ALL NATURAL
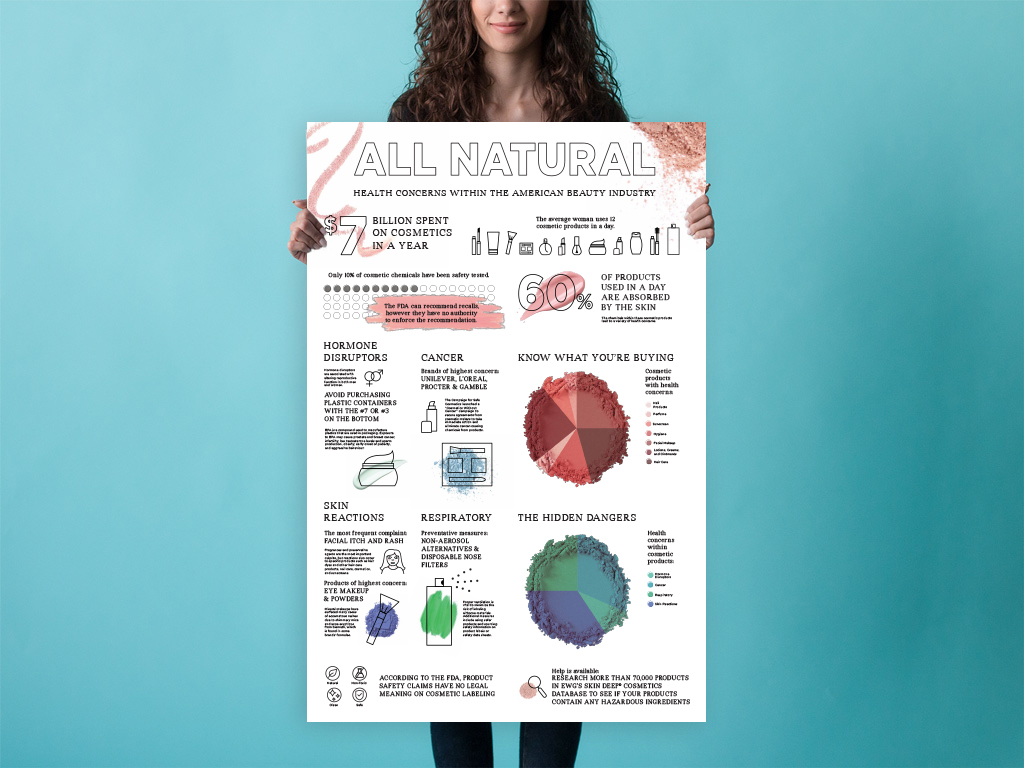
Centered around the health concerns linked to products in the beauty industry, “All Natural” is an infographic designed with the purpose to bring awareness and educate users to the negative affects that American beauty products can have on an individual’s health. Additionally, the project highlights legal regulations on beauty product ingredients with the target audience being a mixture of cosmetic users who are ready to know and not ready to know the following information, but all will be ready to form an opinion.
Data Collection
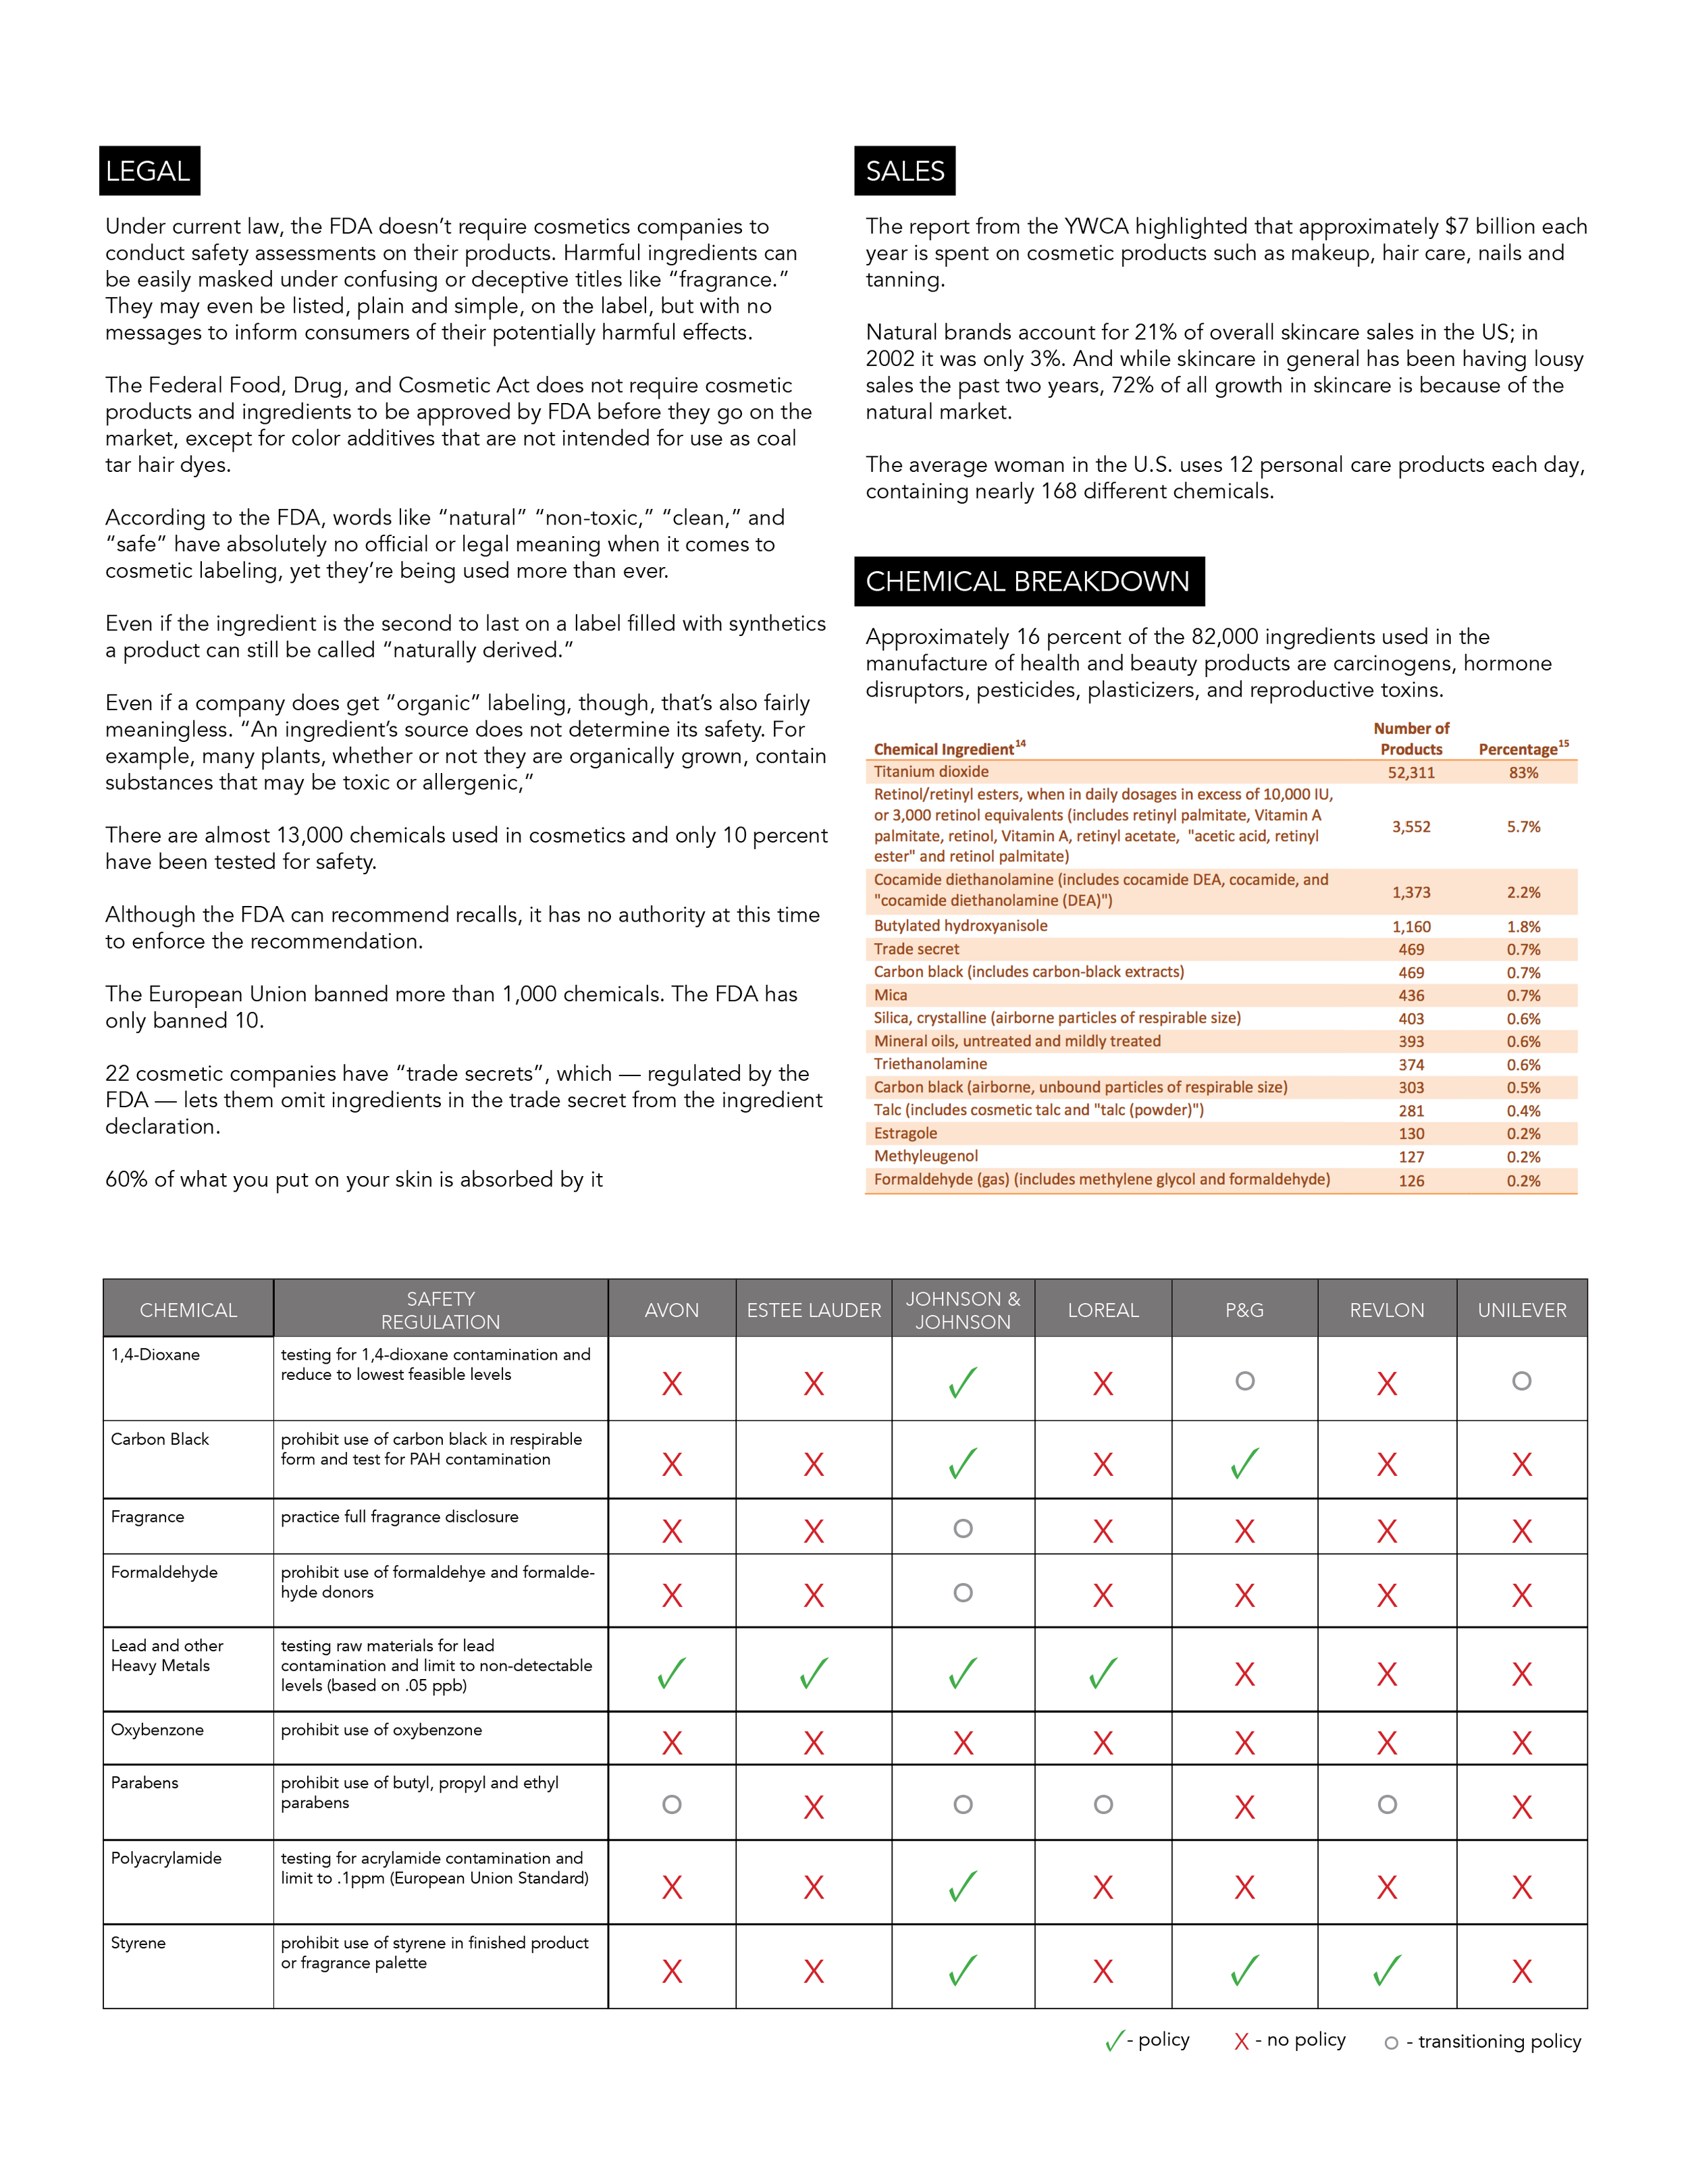
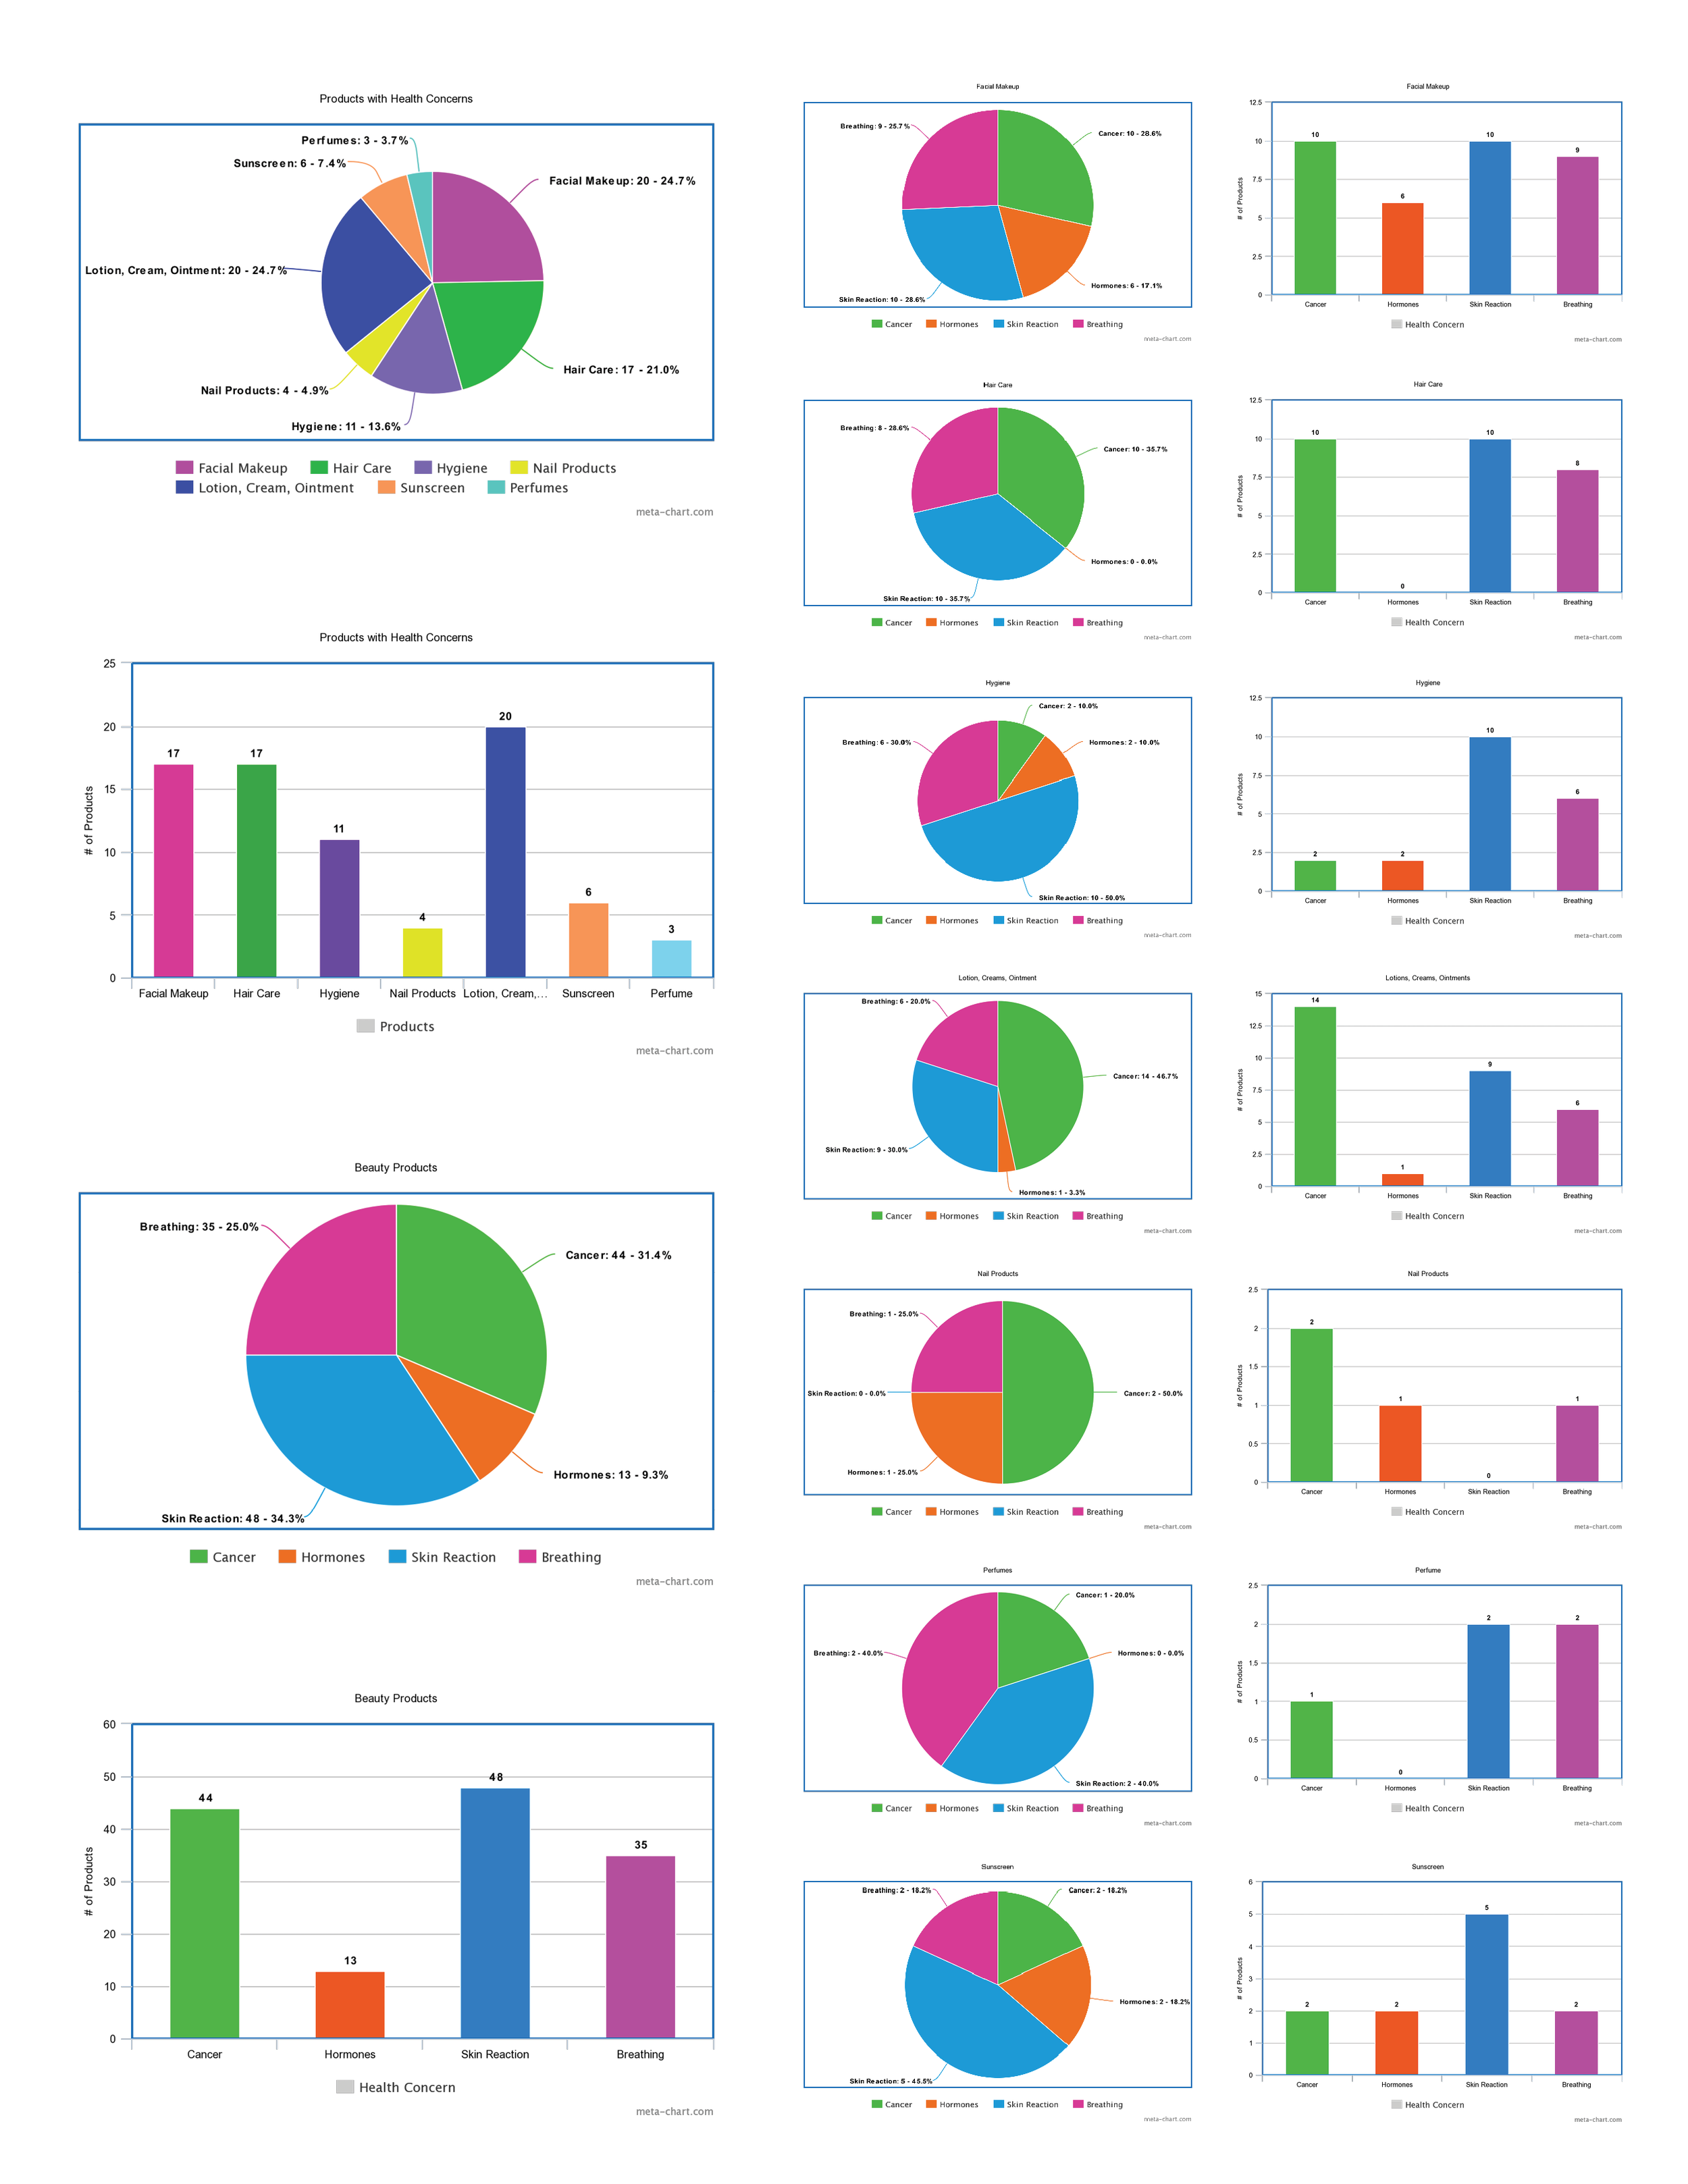
I began the data collection stage by initially focusing my research on the most harmful chemicals that can be found in beauty products and from there diving into the legal restrictions (if any) placed on the specific chemicals, and what beauty product that ingredient can most commonly be found in. After looking at the chemical breakdown I organized the data based on product and health concern, because those categories are more palatable and easier to understand by the wide audience than a list of chemicals would be. From there I created a cumulative list of the main health concerns found in the beauty industry and organized my research based on the concerns and causes of said health concerns. I additionally formulated quantitative charts of the most common health concerns and the products they’re found in to make the information more visually adaptable to a data visualization.


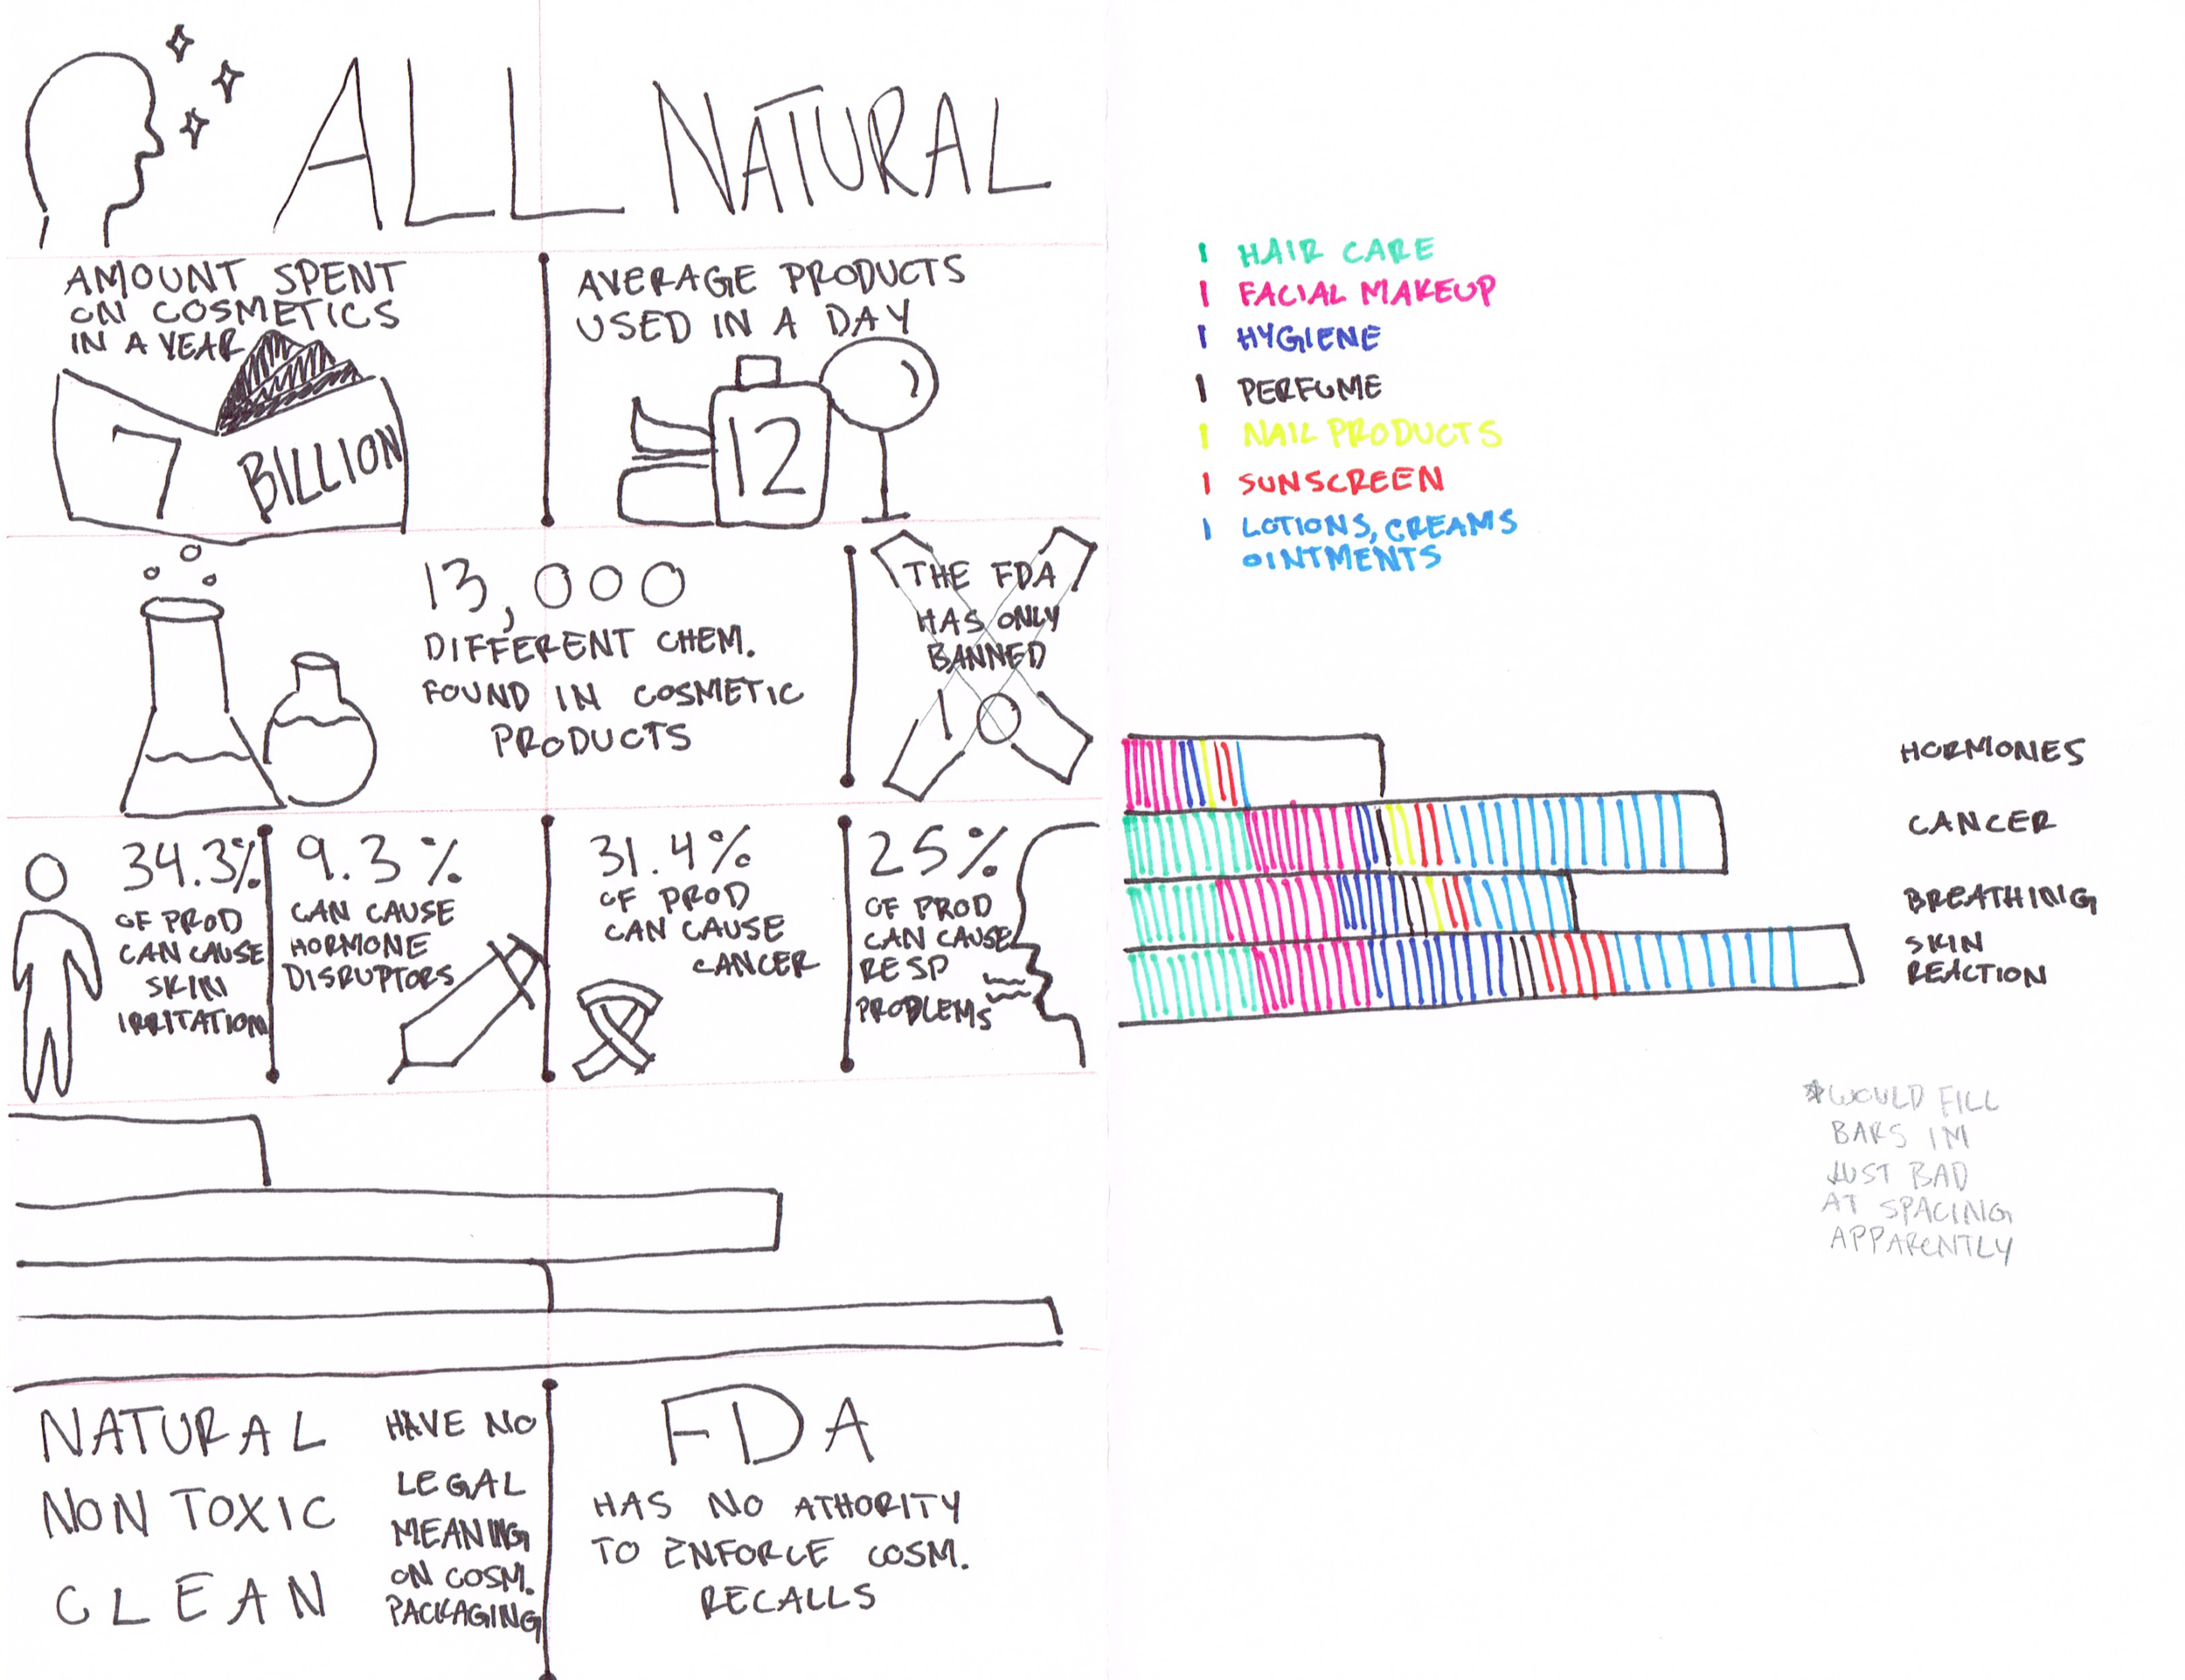
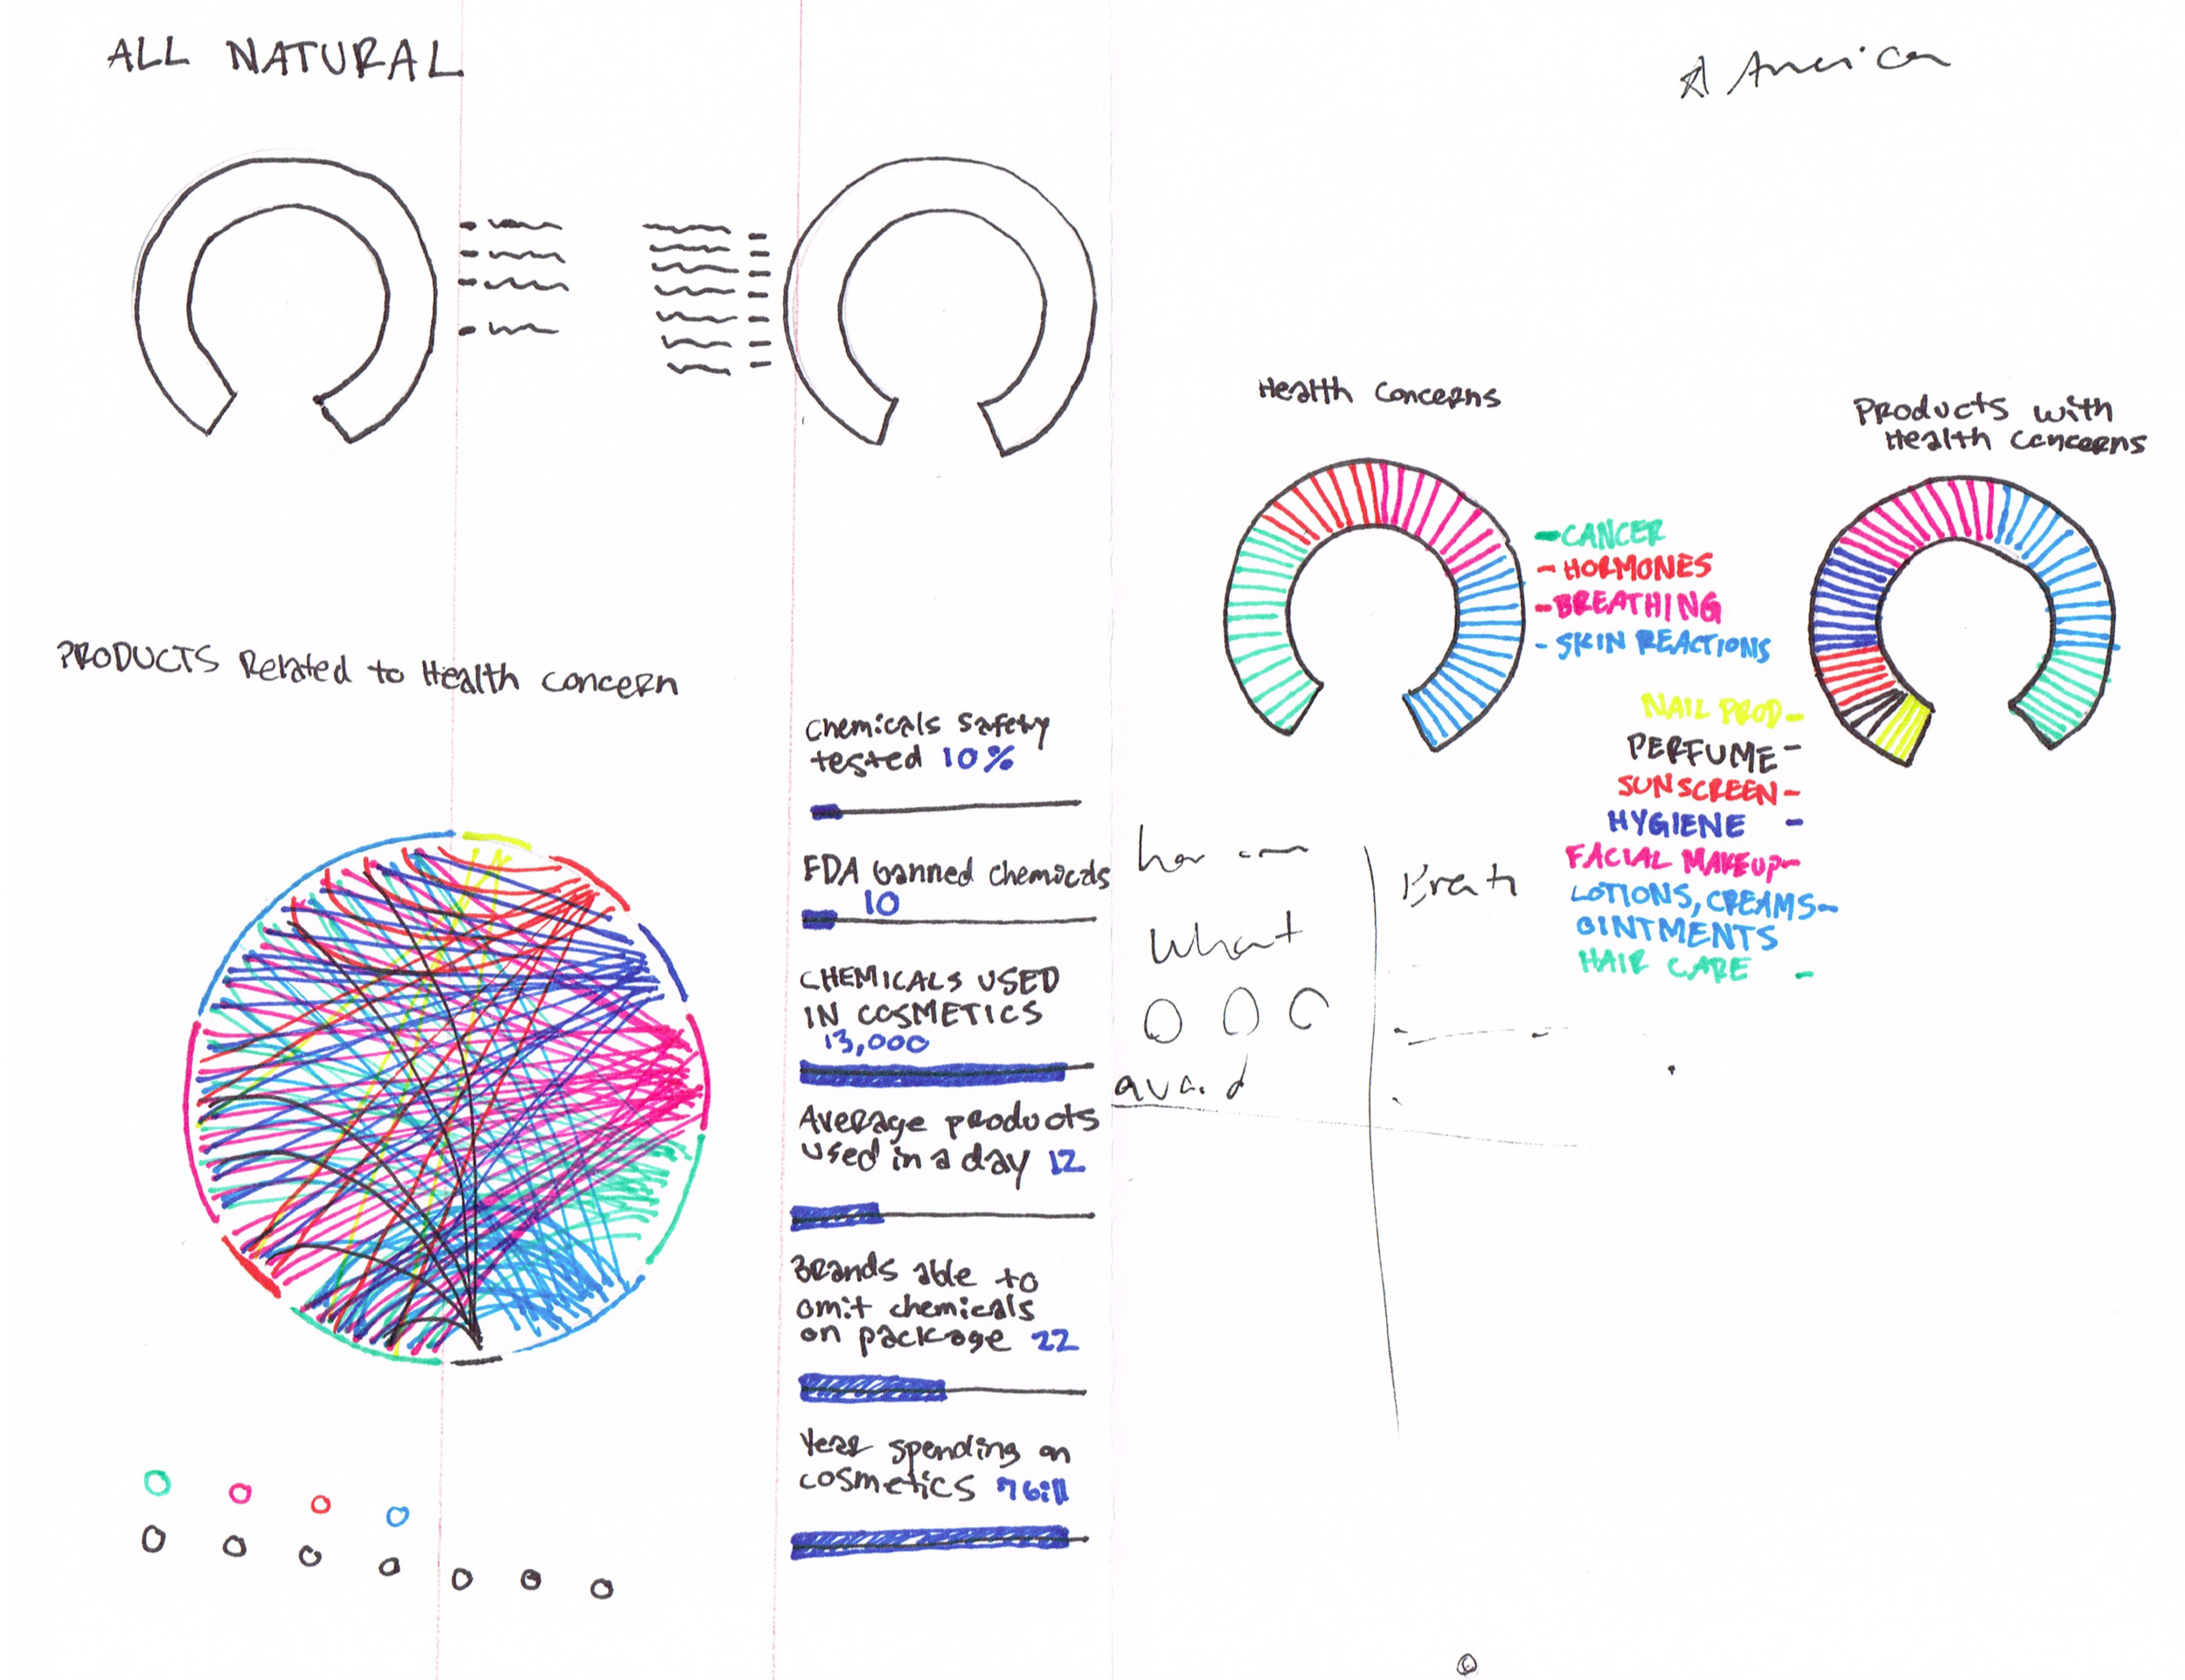
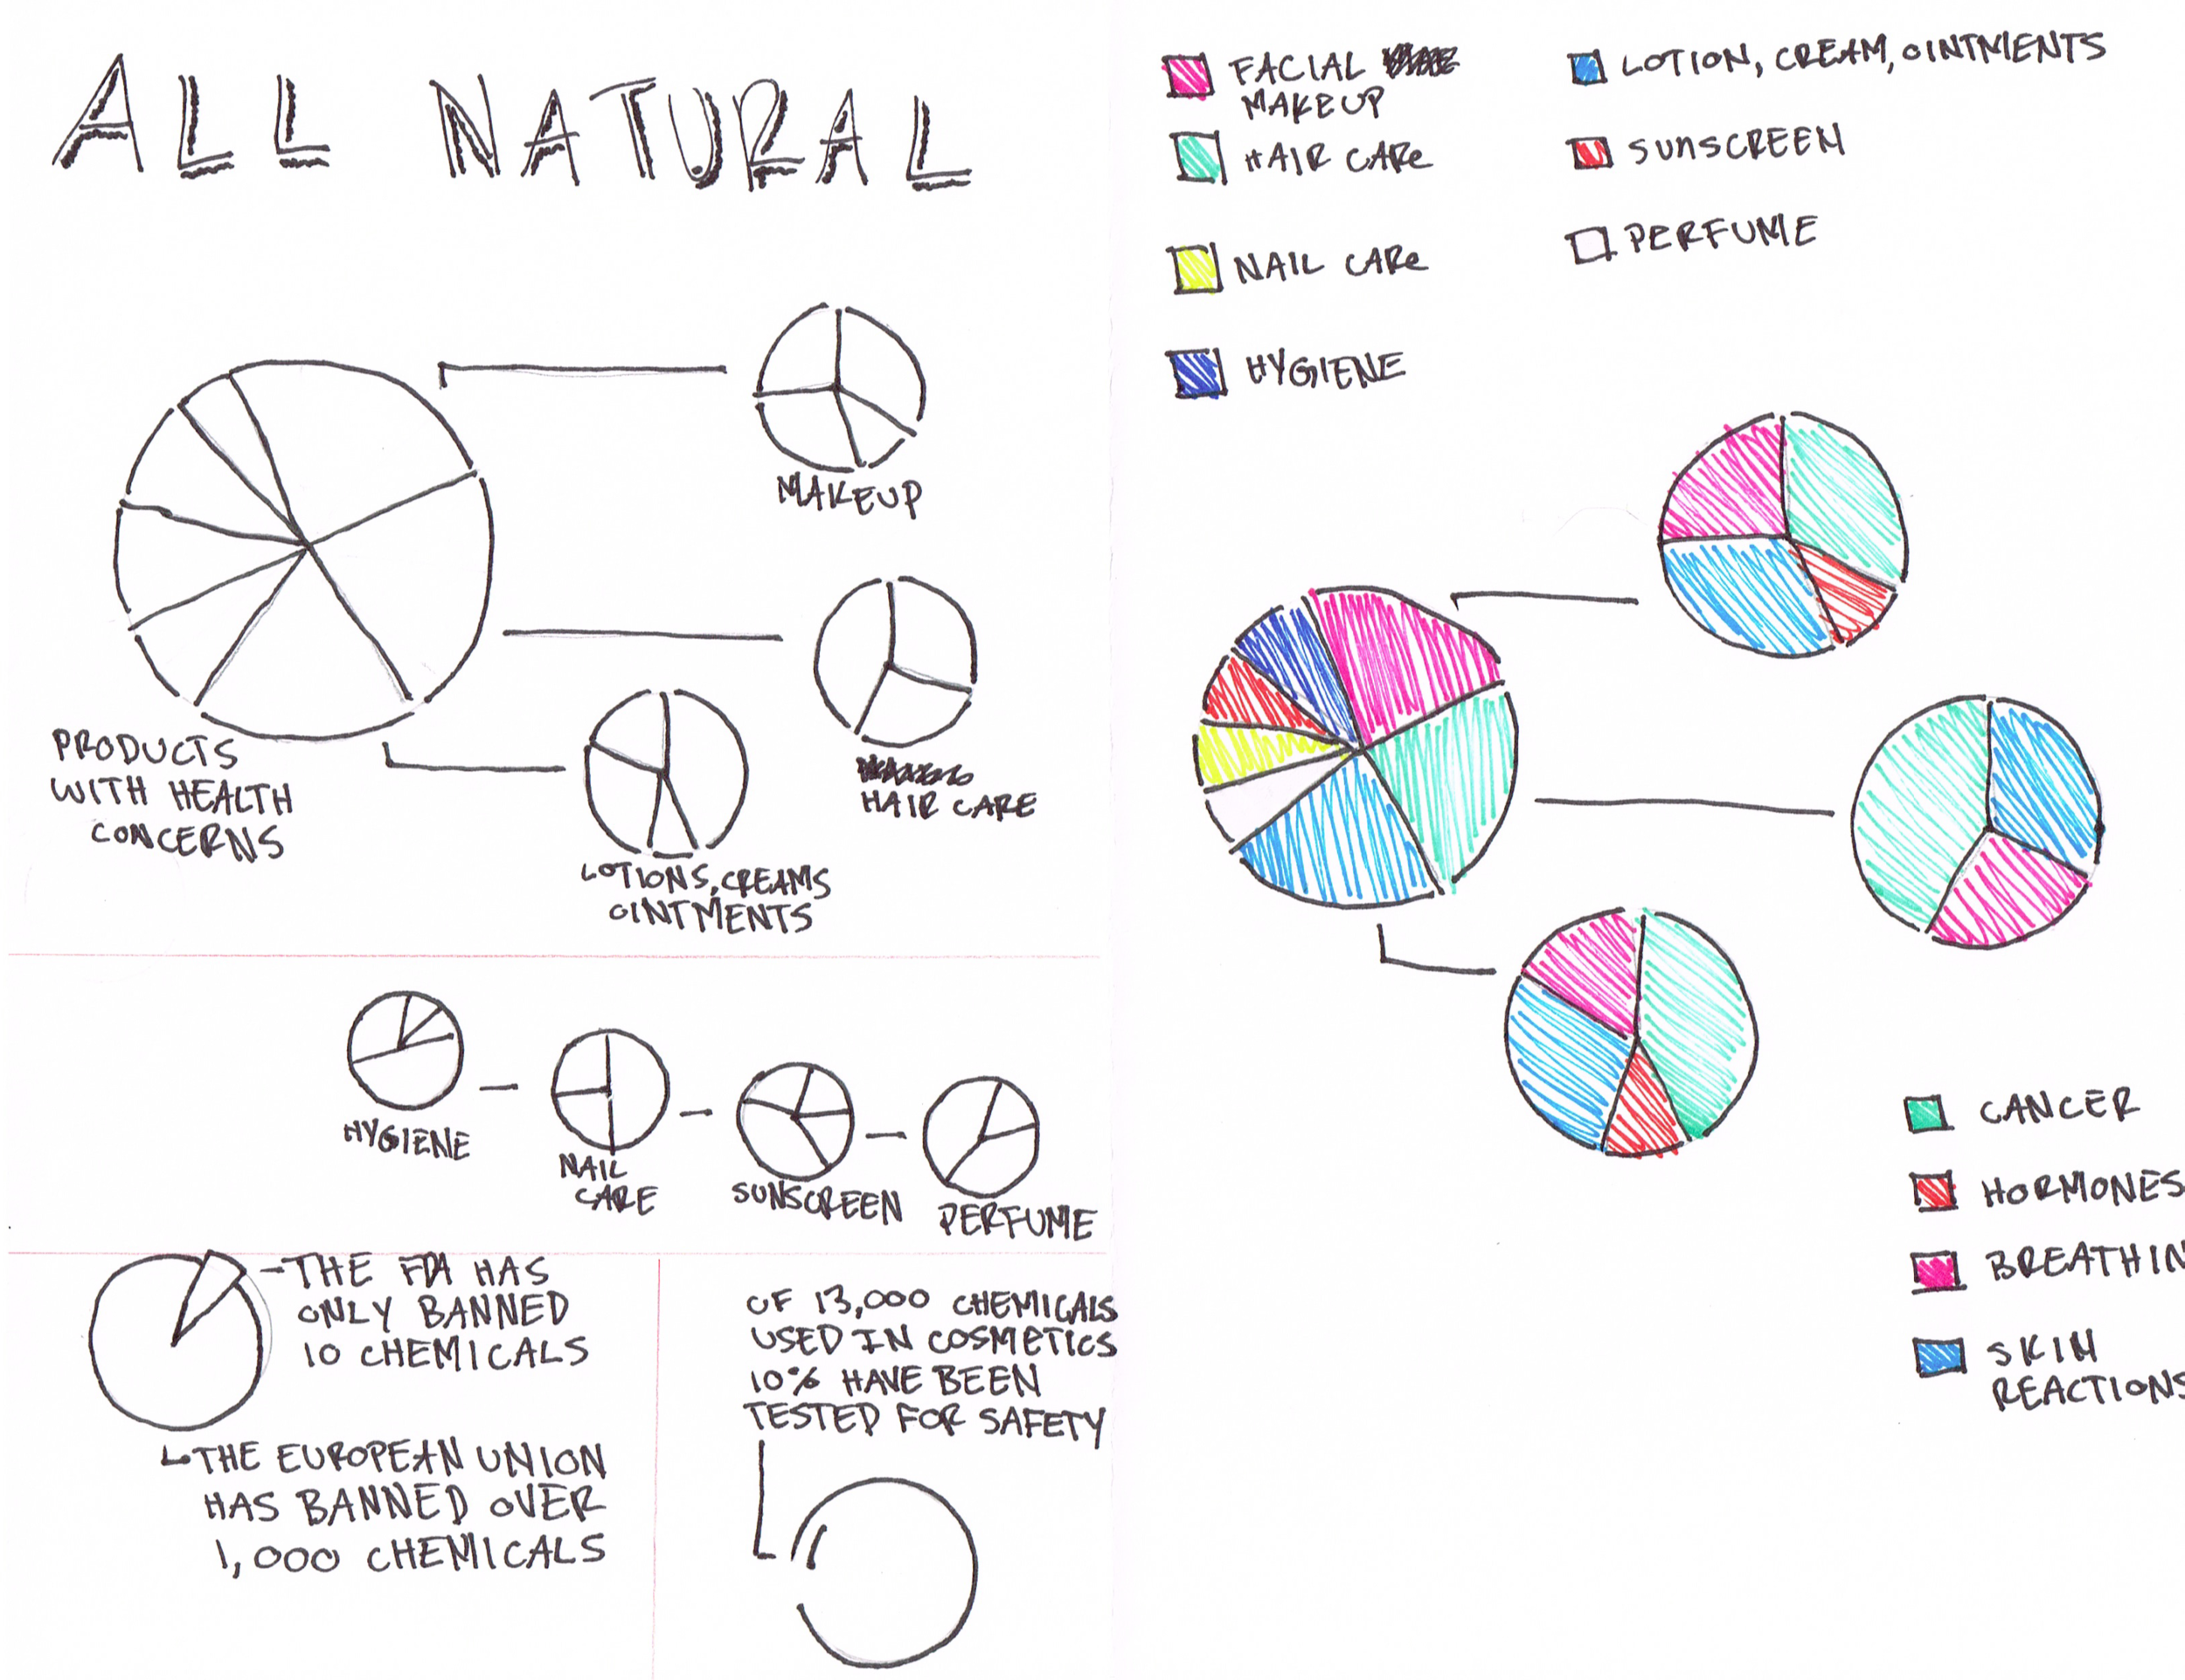
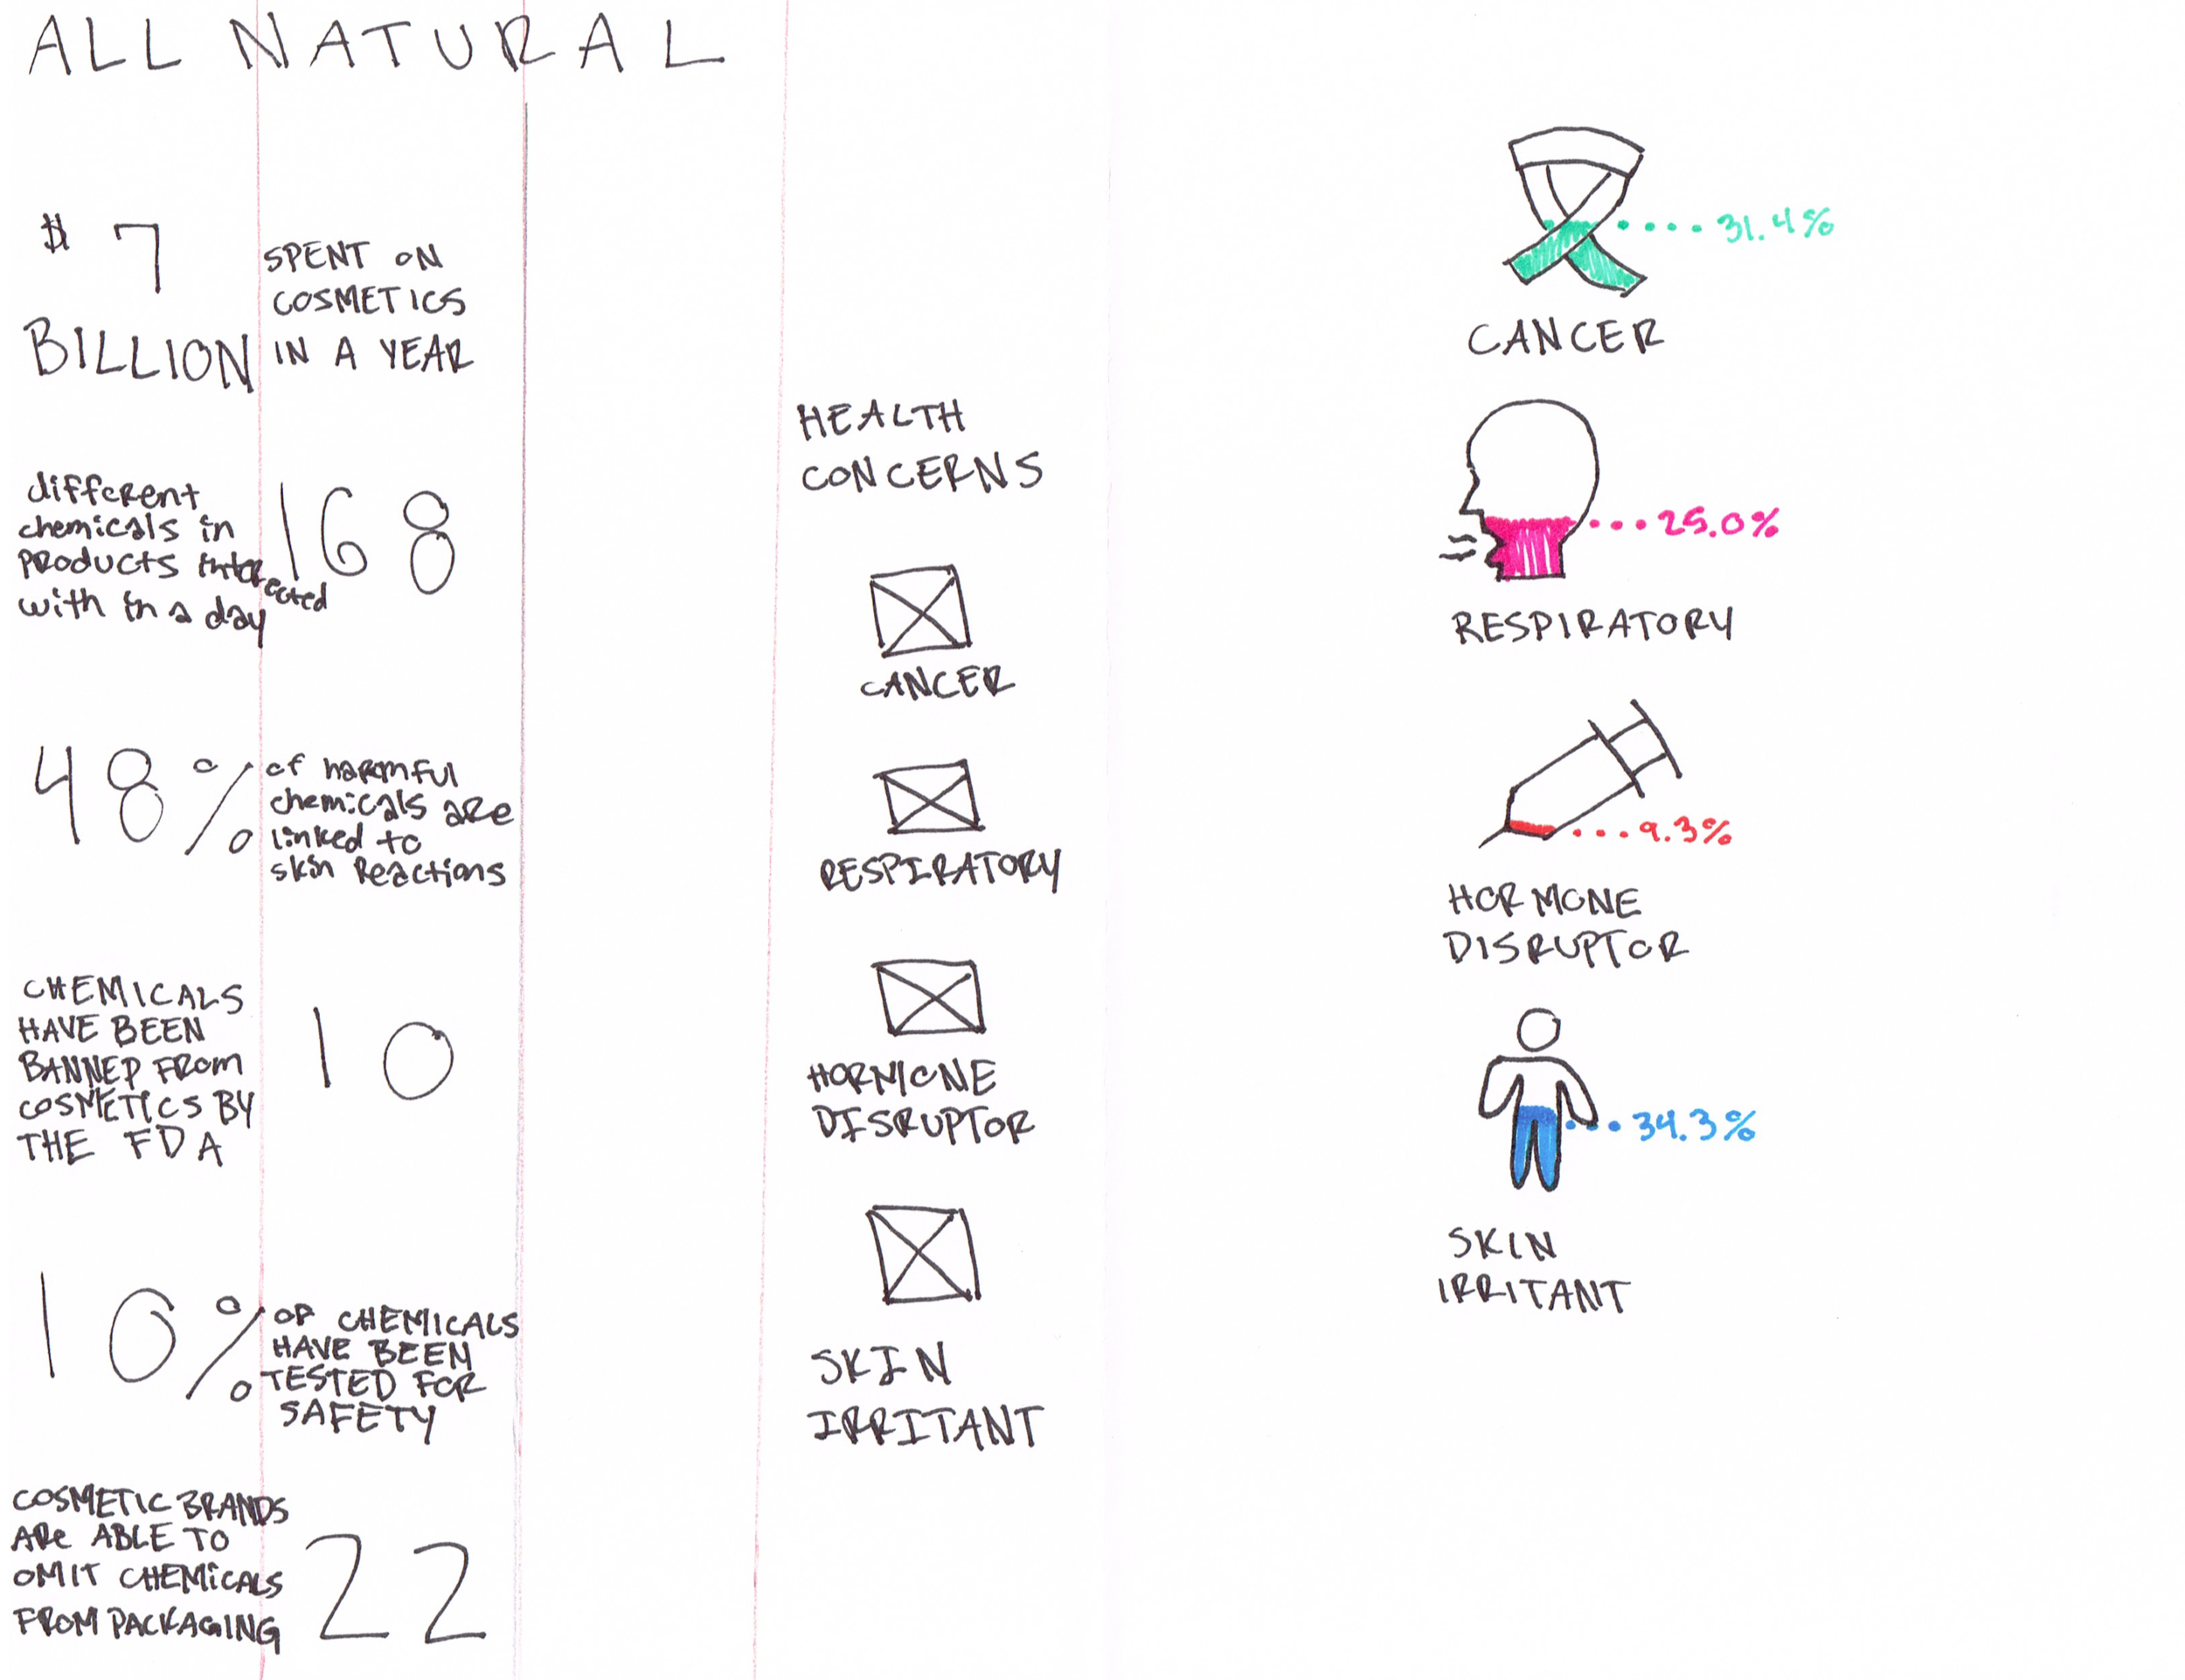
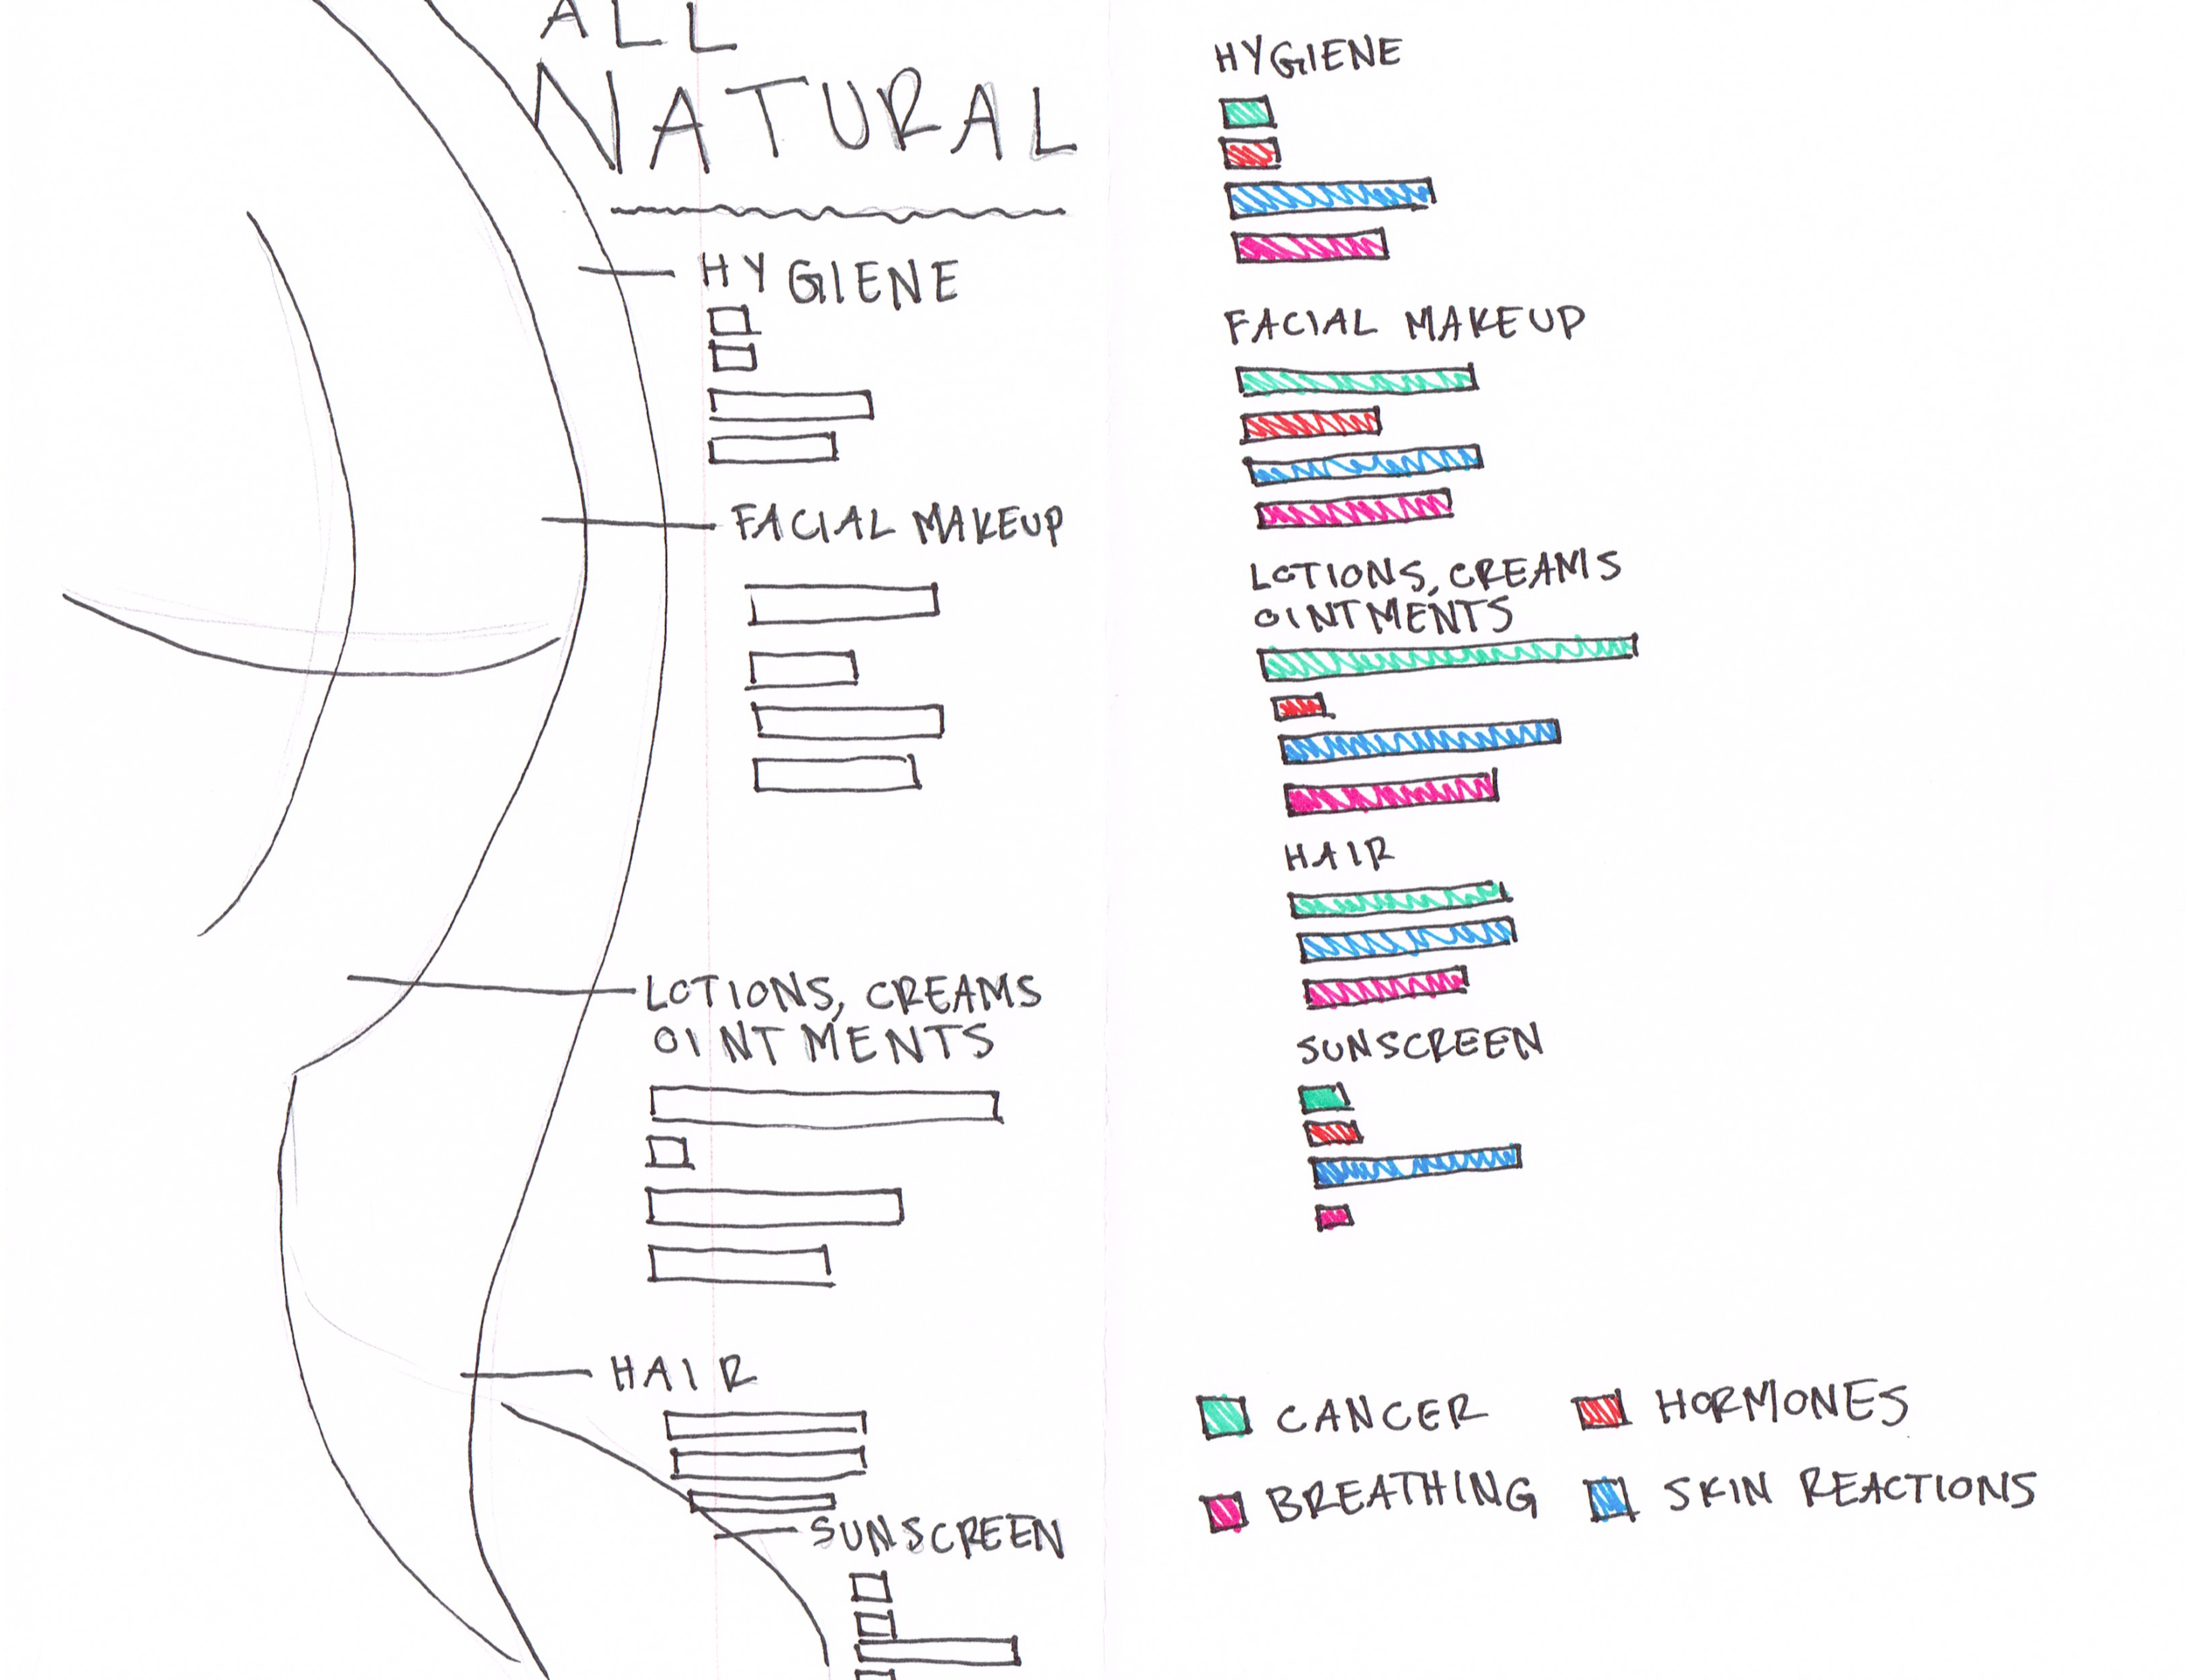
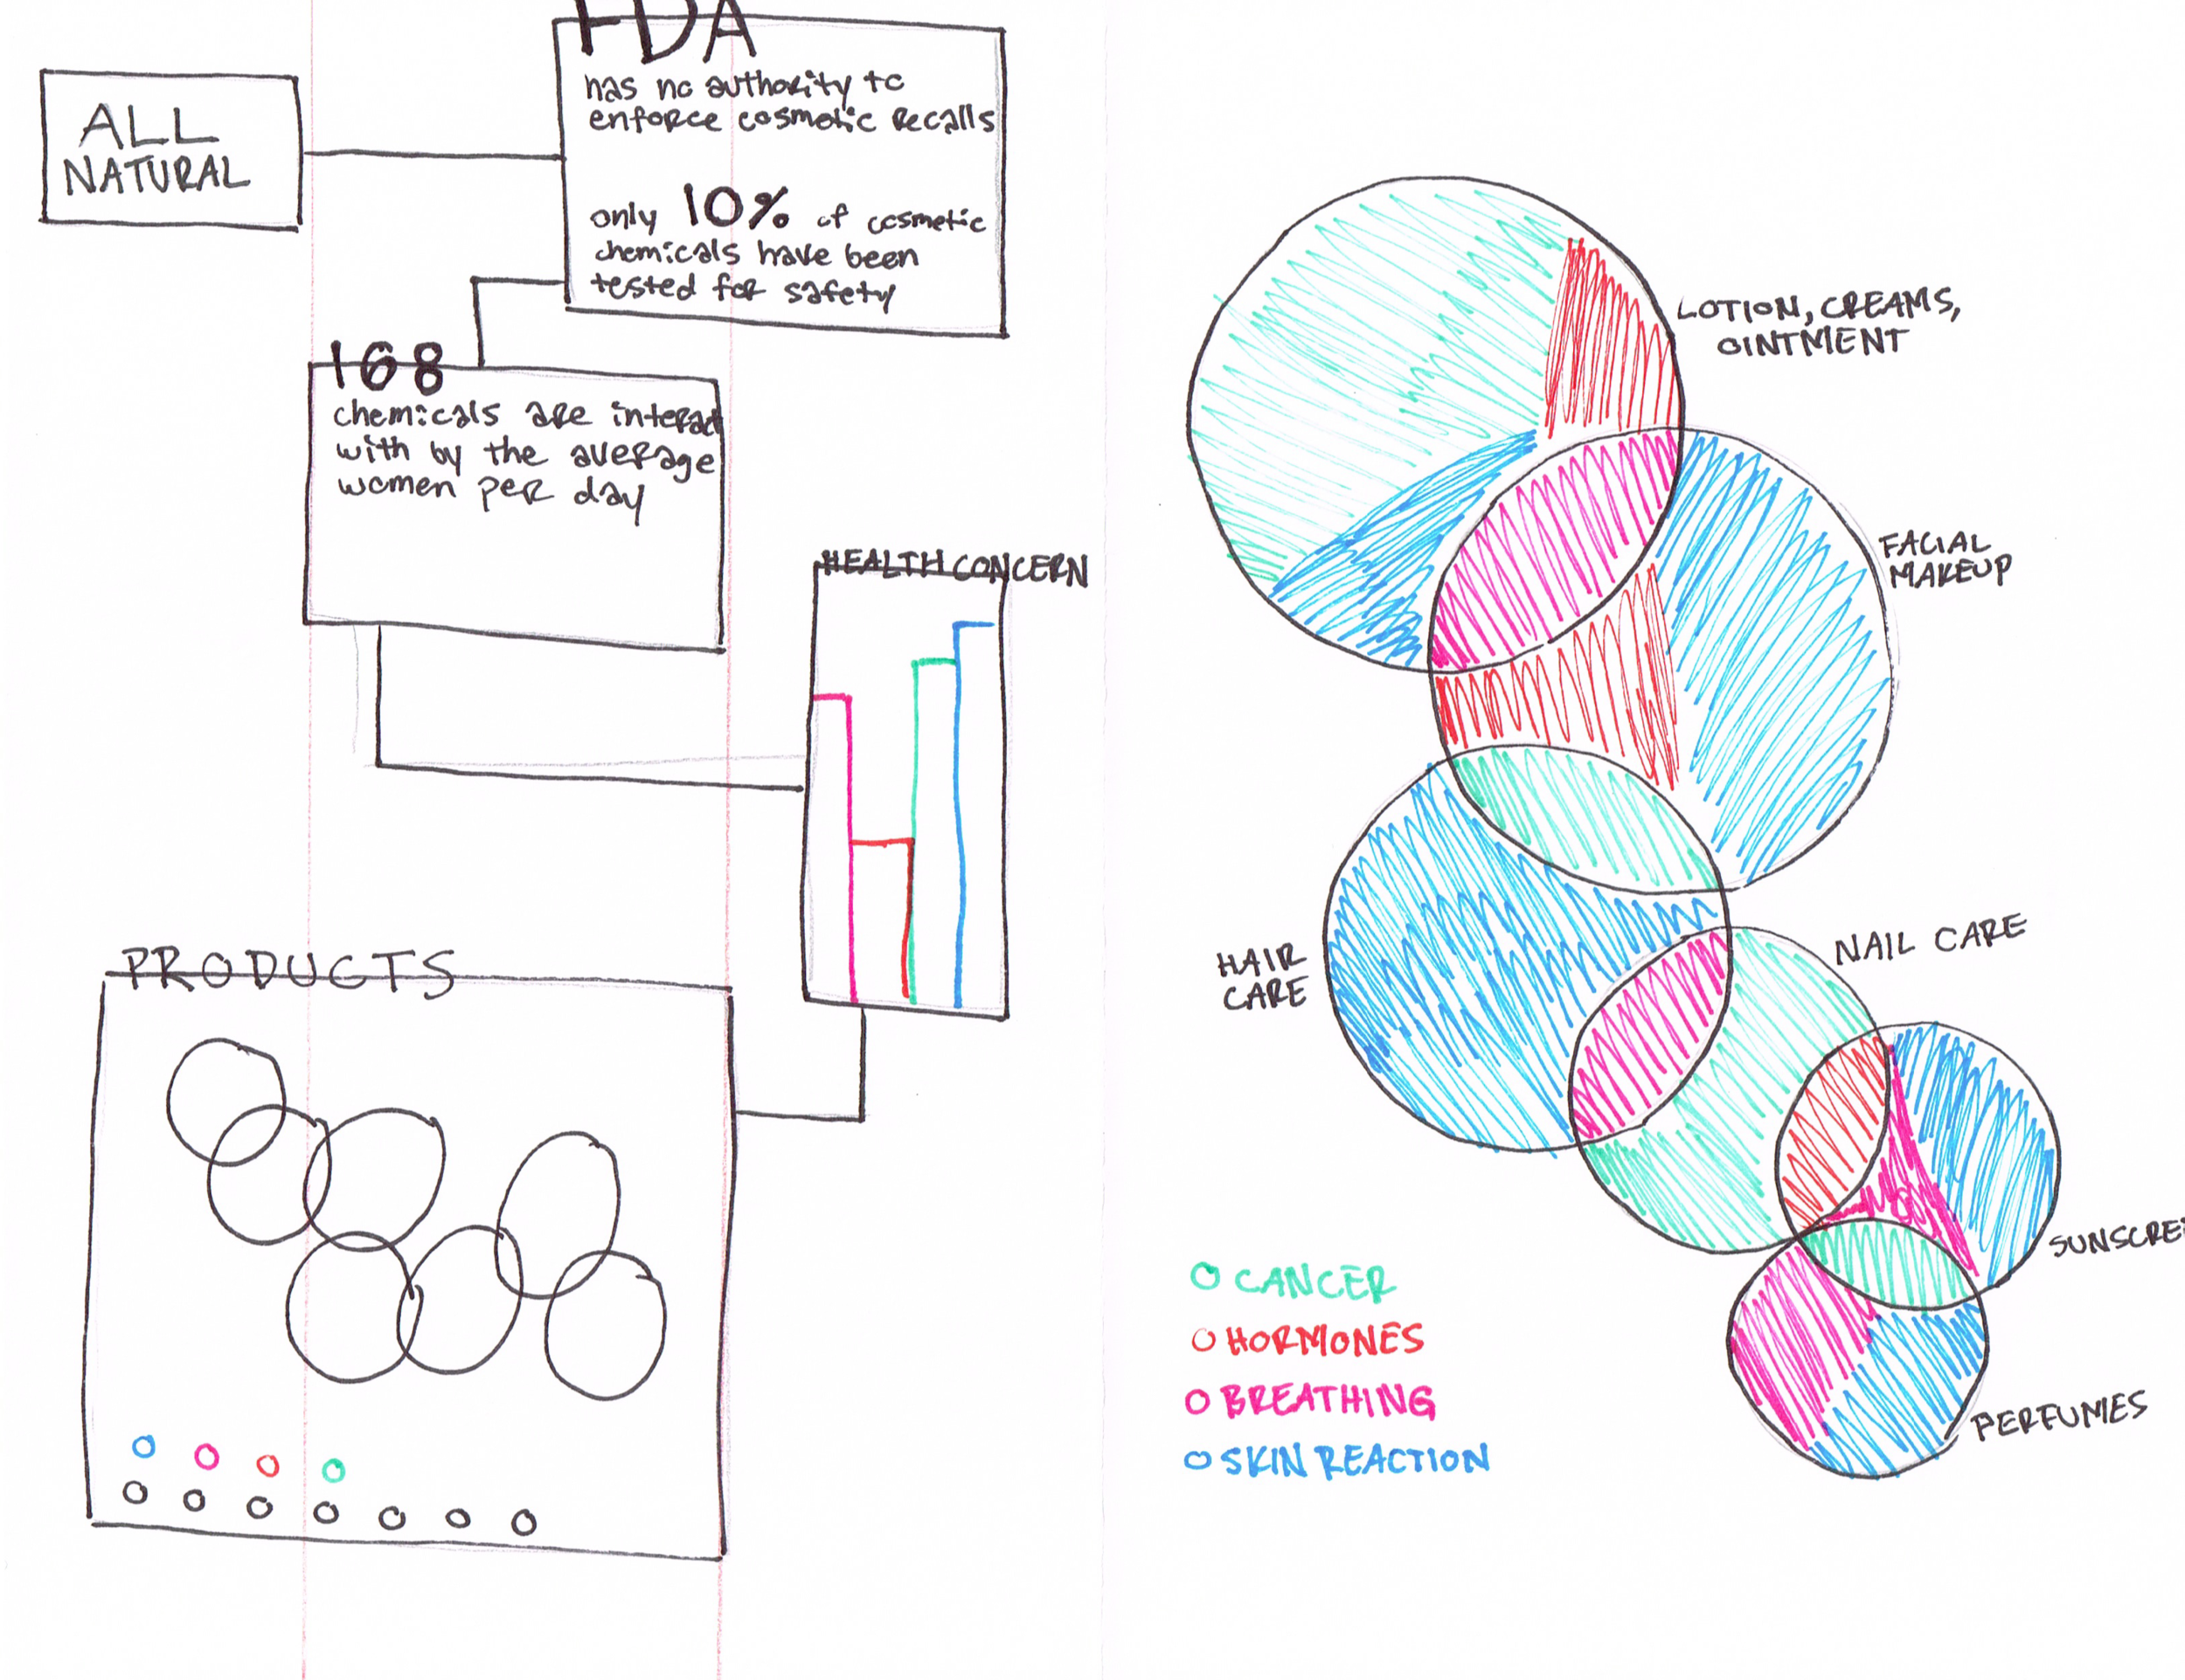
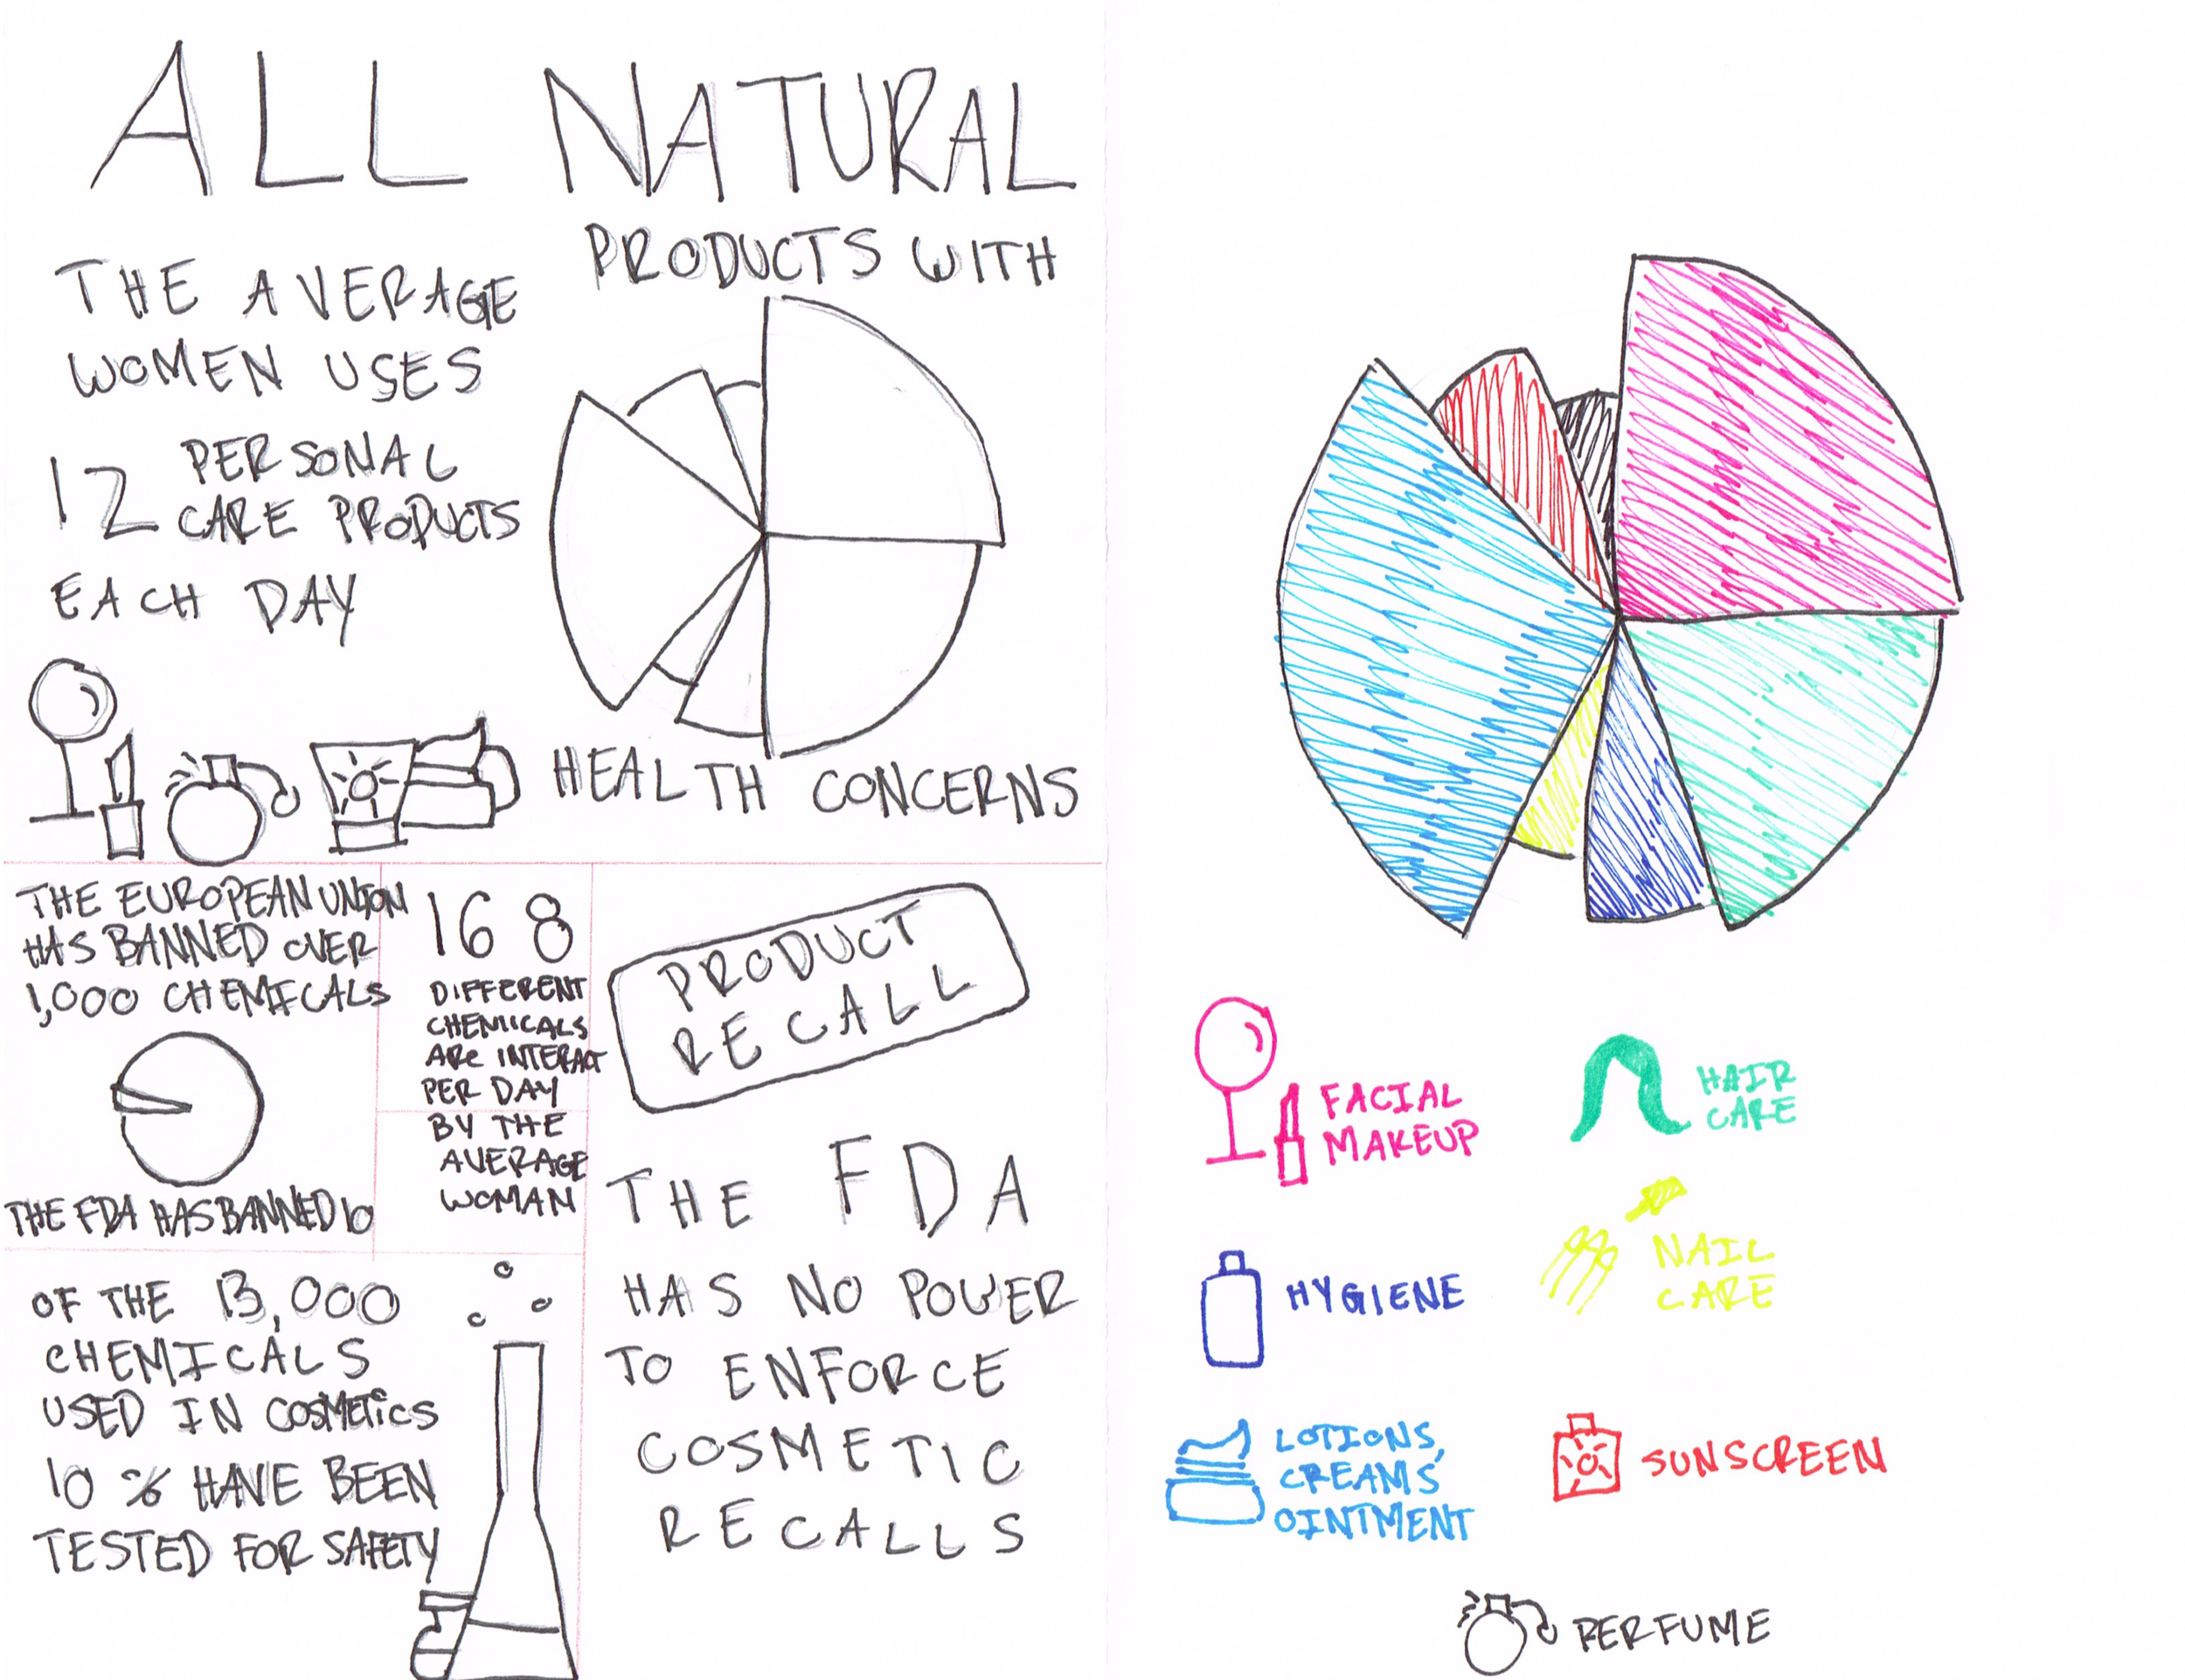
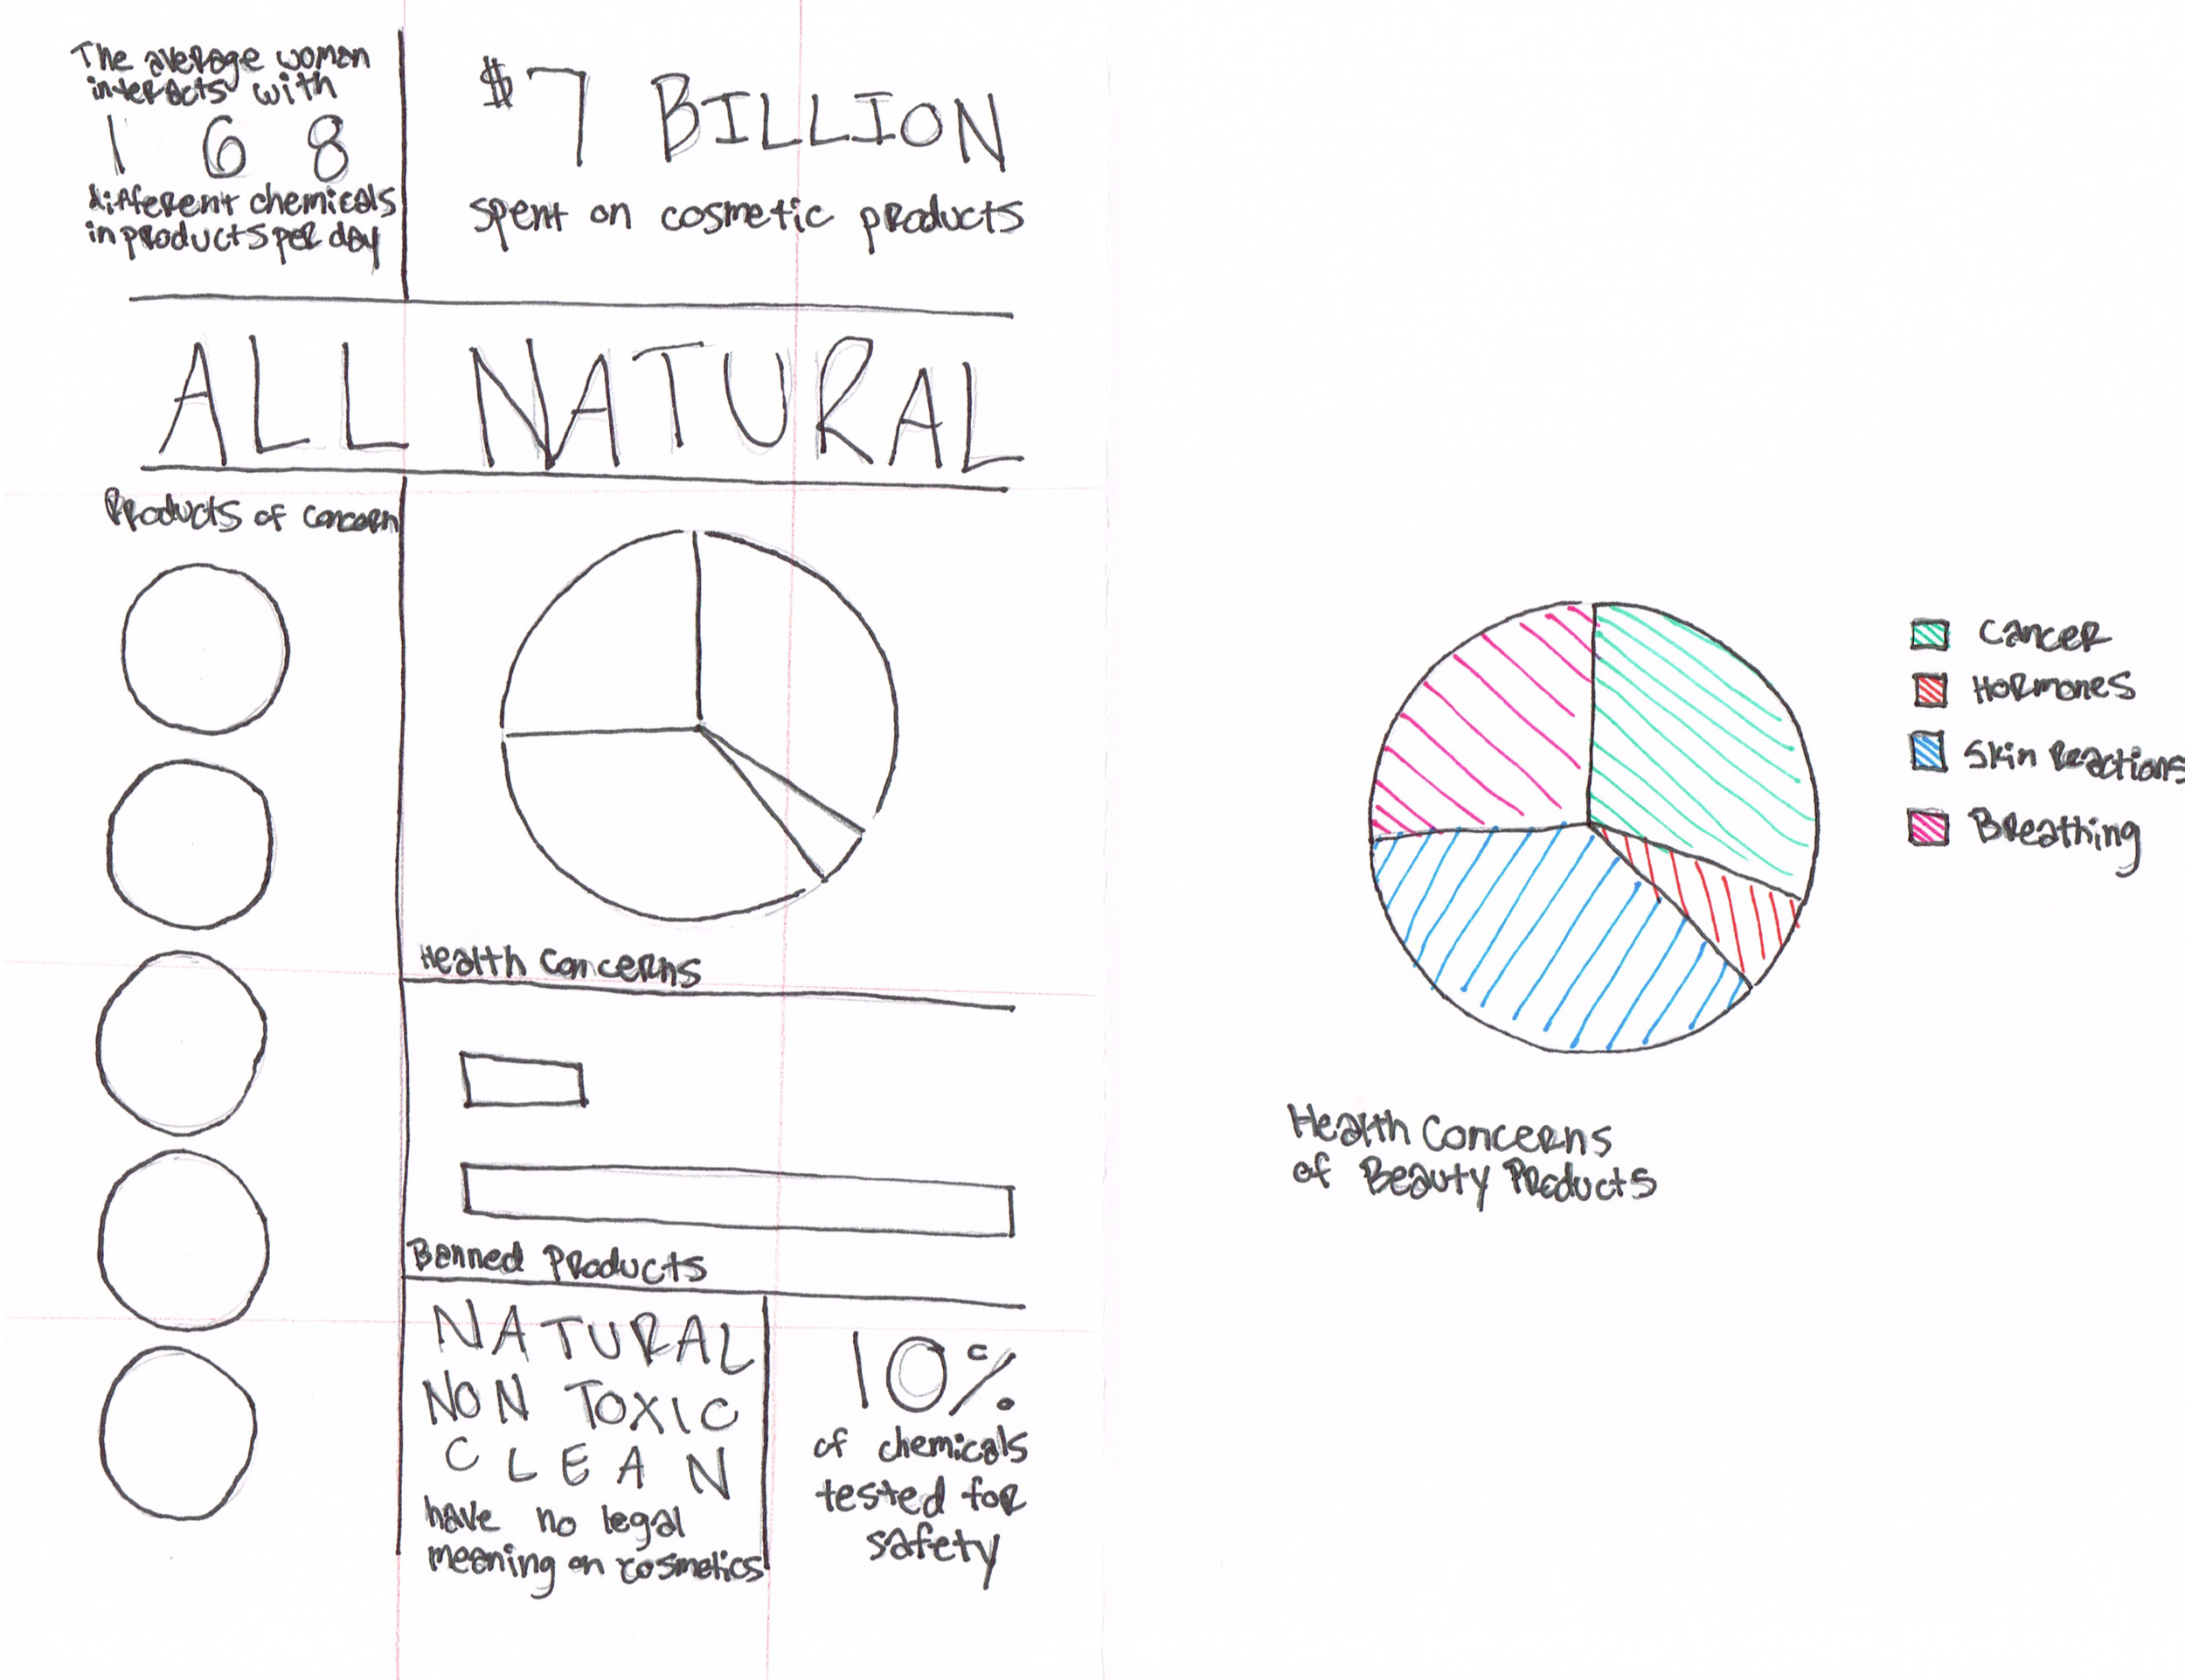
SKETCHES
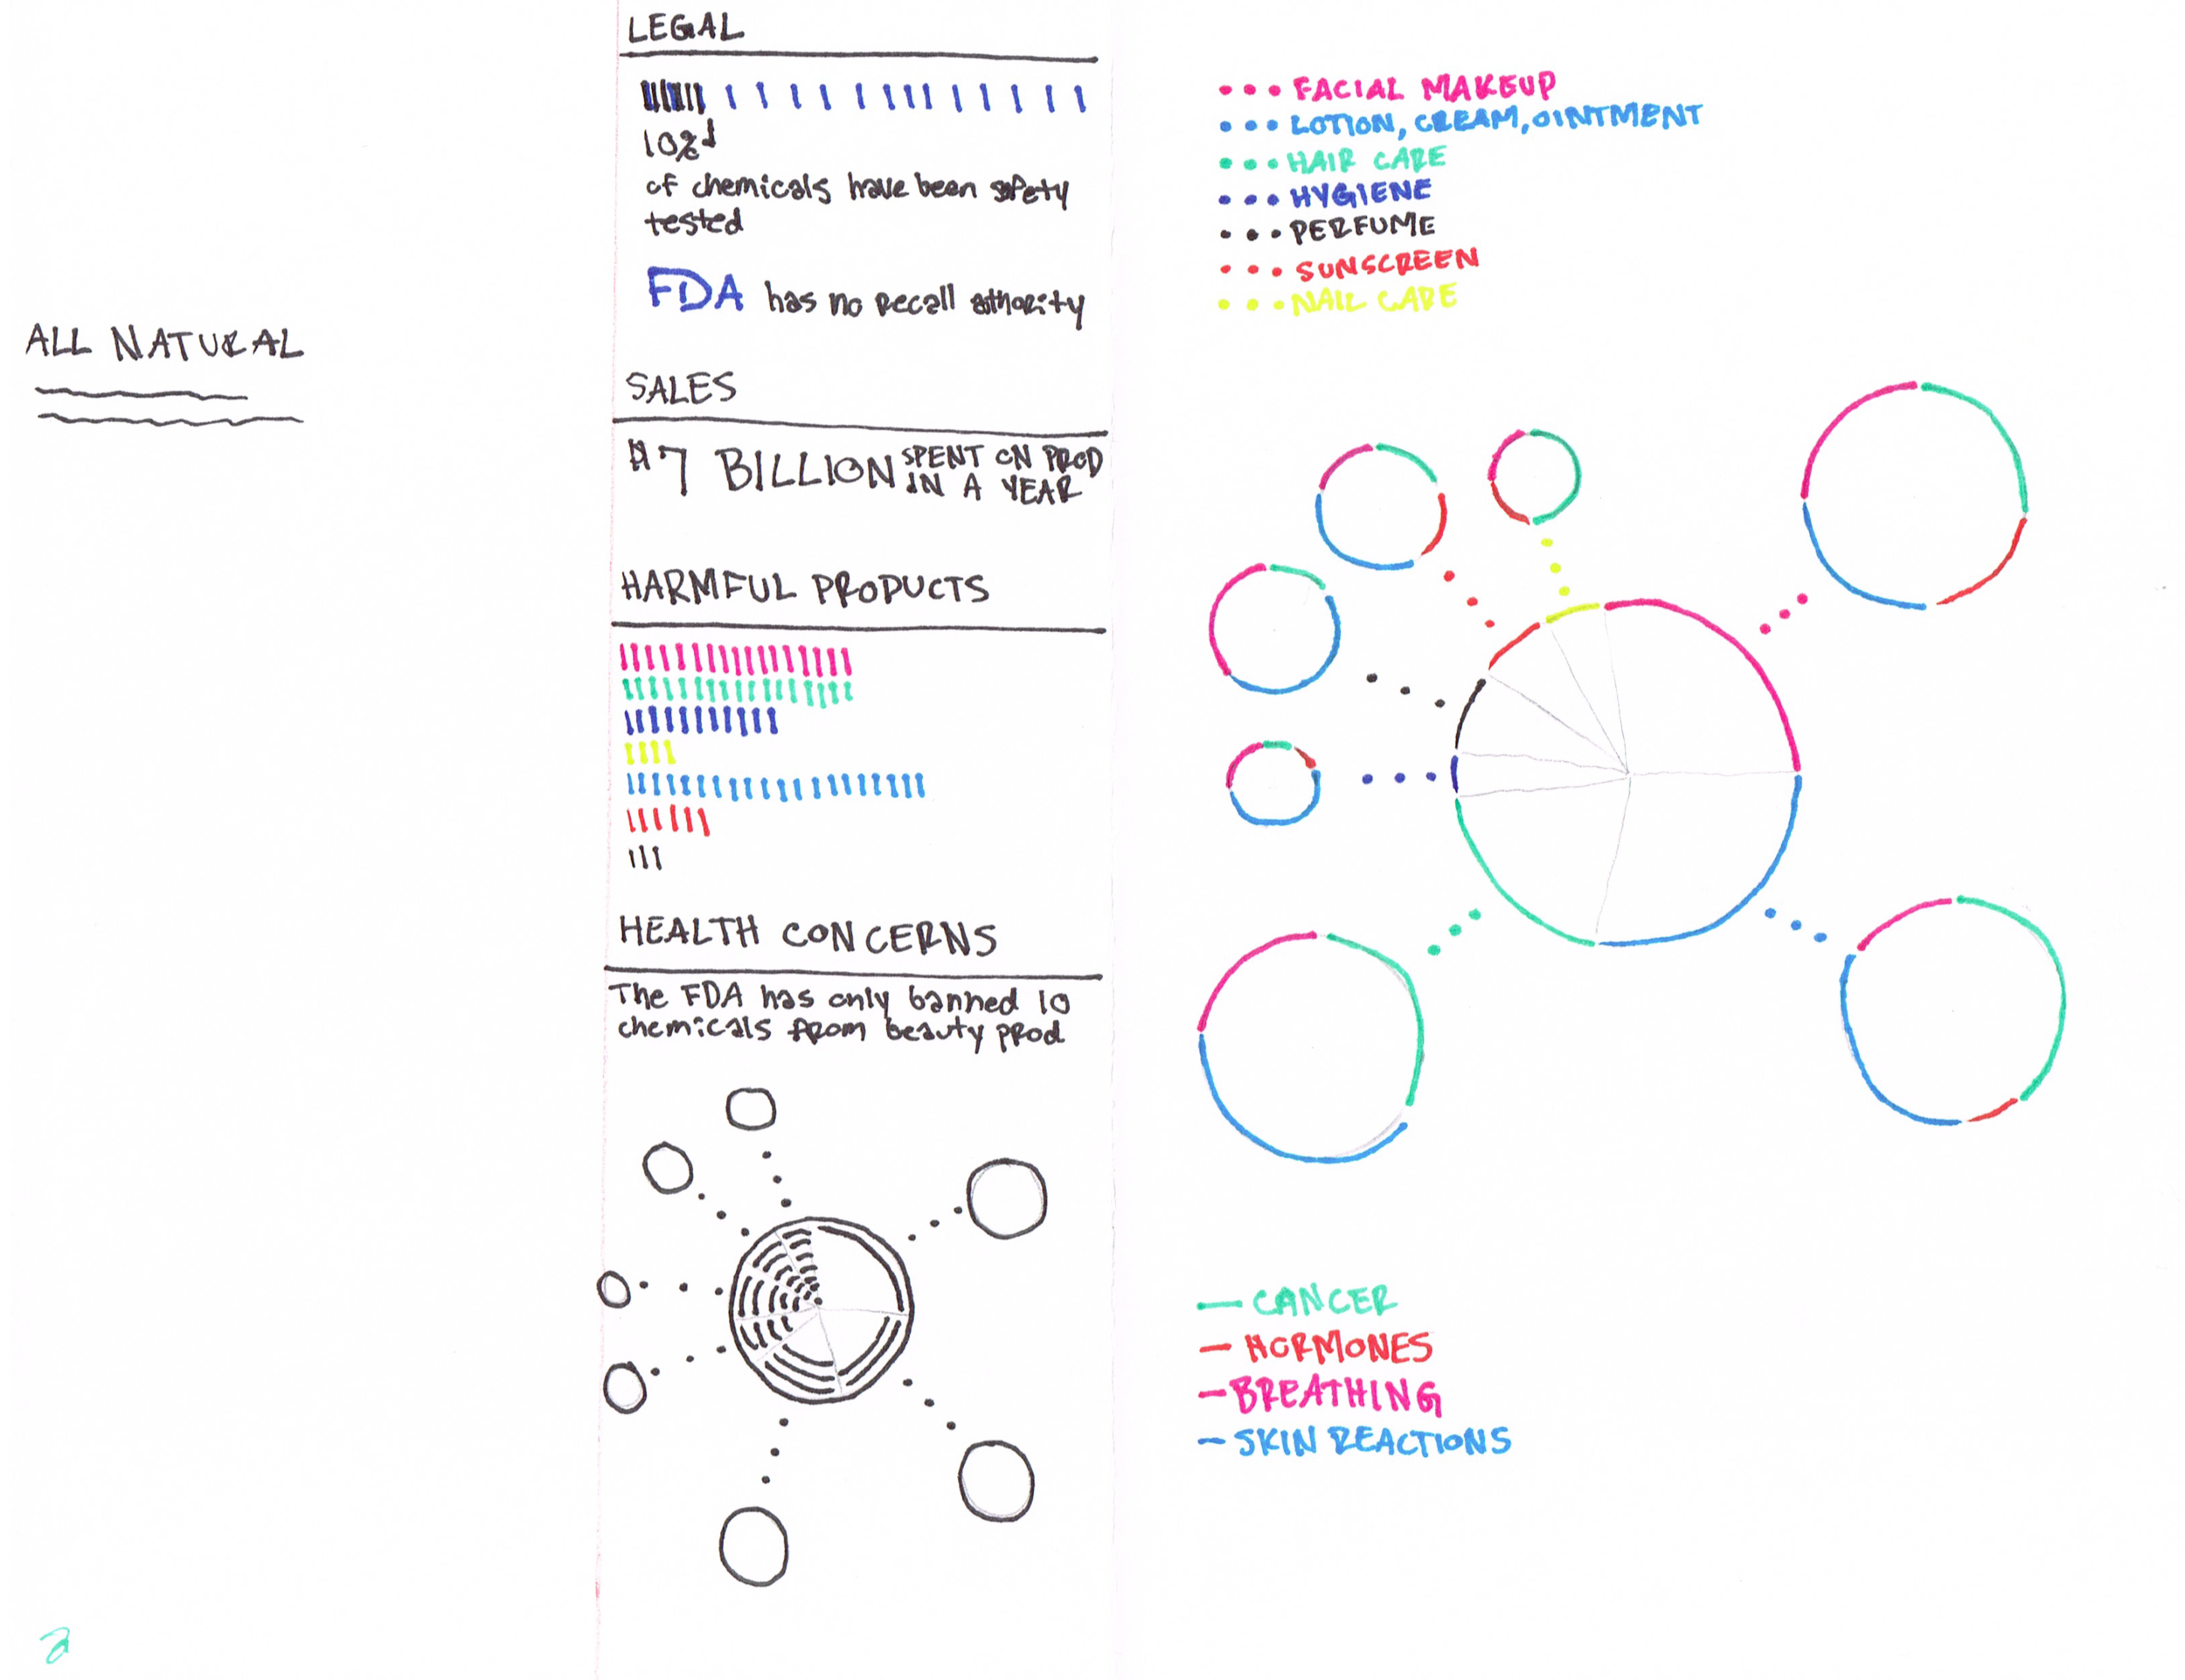
After researching and recording the data, I crafted a variety of sketch approaches that utilized differing hierarchy strategies as well as data visualizations to organize and portray the data in a visually compelling and approachable light for the viewer. Each sketch details the macro (left) and micro (right) approach.

VISUAL SYSTEM
Process
When it came time to transform my sketch concept into digital I started off my crafting a full size sketch layout of the infographic and selecting “puzzle piece” areas too see how the projected visual system communicated the data on a full size application. Throughout the digital iterative process I worked to refine the visual system as to present the information that could easily come across as very heavy in an approachable way that lead the viewer to be more interested in approaching and taking in more information.
Final
With the final infographic I focused strongly on designing a layout that would lead the viewer through an informative story. Starting at the title I proceeded to take the viewer along the path of general beauty industry information, into product usage, and from there to the health concerns that are apparent in these products. After leaving the viewer with the health concerns they should be aware of, I finished out the story of the infographic with what actions can be taken to become more aware of the hazards that directly affect each viewer, since every individuals product usage varies.